
How To Choose Your Research Methodology
Qualitative vs quantitative vs mixed methods.
By: Derek Jansen (MBA). Expert Reviewed By: Dr Eunice Rautenbach | June 2021
Without a doubt, one of the most common questions we receive at Grad Coach is “ How do I choose the right methodology for my research? ”. It’s easy to see why – with so many options on the research design table, it’s easy to get intimidated, especially with all the complex lingo!
In this post, we’ll explain the three overarching types of research – qualitative, quantitative and mixed methods – and how you can go about choosing the best methodological approach for your research.
Overview: Choosing Your Methodology
Understanding the options – Qualitative research – Quantitative research – Mixed methods-based research
Choosing a research methodology – Nature of the research – Research area norms – Practicalities

1. Understanding the options
Before we jump into the question of how to choose a research methodology, it’s useful to take a step back to understand the three overarching types of research – qualitative , quantitative and mixed methods -based research. Each of these options takes a different methodological approach.
Qualitative research utilises data that is not numbers-based. In other words, qualitative research focuses on words , descriptions , concepts or ideas – while quantitative research makes use of numbers and statistics. Qualitative research investigates the “softer side” of things to explore and describe, while quantitative research focuses on the “hard numbers”, to measure differences between variables and the relationships between them.
Importantly, qualitative research methods are typically used to explore and gain a deeper understanding of the complexity of a situation – to draw a rich picture . In contrast to this, quantitative methods are usually used to confirm or test hypotheses . In other words, they have distinctly different purposes. The table below highlights a few of the key differences between qualitative and quantitative research – you can learn more about the differences here.
- Uses an inductive approach
- Is used to build theories
- Takes a subjective approach
- Adopts an open and flexible approach
- The researcher is close to the respondents
- Interviews and focus groups are oftentimes used to collect word-based data.
- Generally, draws on small sample sizes
- Uses qualitative data analysis techniques (e.g. content analysis , thematic analysis , etc)
- Uses a deductive approach
- Is used to test theories
- Takes an objective approach
- Adopts a closed, highly planned approach
- The research is disconnected from respondents
- Surveys or laboratory equipment are often used to collect number-based data.
- Generally, requires large sample sizes
- Uses statistical analysis techniques to make sense of the data
Mixed methods -based research, as you’d expect, attempts to bring these two types of research together, drawing on both qualitative and quantitative data. Quite often, mixed methods-based studies will use qualitative research to explore a situation and develop a potential model of understanding (this is called a conceptual framework), and then go on to use quantitative methods to test that model empirically.
In other words, while qualitative and quantitative methods (and the philosophies that underpin them) are completely different, they are not at odds with each other. It’s not a competition of qualitative vs quantitative. On the contrary, they can be used together to develop a high-quality piece of research. Of course, this is easier said than done, so we usually recommend that first-time researchers stick to a single approach , unless the nature of their study truly warrants a mixed-methods approach.
The key takeaway here, and the reason we started by looking at the three options, is that it’s important to understand that each methodological approach has a different purpose – for example, to explore and understand situations (qualitative), to test and measure (quantitative) or to do both. They’re not simply alternative tools for the same job.
Right – now that we’ve got that out of the way, let’s look at how you can go about choosing the right methodology for your research.

2. How to choose a research methodology
To choose the right research methodology for your dissertation or thesis, you need to consider three important factors . Based on these three factors, you can decide on your overarching approach – qualitative, quantitative or mixed methods. Once you’ve made that decision, you can flesh out the finer details of your methodology, such as the sampling , data collection methods and analysis techniques (we discuss these separately in other posts ).
The three factors you need to consider are:
- The nature of your research aims, objectives and research questions
- The methodological approaches taken in the existing literature
- Practicalities and constraints
Let’s take a look at each of these.
Factor #1: The nature of your research
As I mentioned earlier, each type of research (and therefore, research methodology), whether qualitative, quantitative or mixed, has a different purpose and helps solve a different type of question. So, it’s logical that the key deciding factor in terms of which research methodology you adopt is the nature of your research aims, objectives and research questions .
But, what types of research exist?
Broadly speaking, research can fall into one of three categories:
- Exploratory – getting a better understanding of an issue and potentially developing a theory regarding it
- Confirmatory – confirming a potential theory or hypothesis by testing it empirically
- A mix of both – building a potential theory or hypothesis and then testing it
As a rule of thumb, exploratory research tends to adopt a qualitative approach , whereas confirmatory research tends to use quantitative methods . This isn’t set in stone, but it’s a very useful heuristic. Naturally then, research that combines a mix of both, or is seeking to develop a theory from the ground up and then test that theory, would utilize a mixed-methods approach.

Let’s look at an example in action.
If your research aims were to understand the perspectives of war veterans regarding certain political matters, you’d likely adopt a qualitative methodology, making use of interviews to collect data and one or more qualitative data analysis methods to make sense of the data.
If, on the other hand, your research aims involved testing a set of hypotheses regarding the link between political leaning and income levels, you’d likely adopt a quantitative methodology, using numbers-based data from a survey to measure the links between variables and/or constructs .
So, the first (and most important thing) thing you need to consider when deciding which methodological approach to use for your research project is the nature of your research aims , objectives and research questions. Specifically, you need to assess whether your research leans in an exploratory or confirmatory direction or involves a mix of both.
The importance of achieving solid alignment between these three factors and your methodology can’t be overstated. If they’re misaligned, you’re going to be forcing a square peg into a round hole. In other words, you’ll be using the wrong tool for the job, and your research will become a disjointed mess.
If your research is a mix of both exploratory and confirmatory, but you have a tight word count limit, you may need to consider trimming down the scope a little and focusing on one or the other. One methodology executed well has a far better chance of earning marks than a poorly executed mixed methods approach. So, don’t try to be a hero, unless there is a very strong underpinning logic.
Need a helping hand?
Factor #2: The disciplinary norms
Choosing the right methodology for your research also involves looking at the approaches used by other researchers in the field, and studies with similar research aims and objectives to yours. Oftentimes, within a discipline, there is a common methodological approach (or set of approaches) used in studies. While this doesn’t mean you should follow the herd “just because”, you should at least consider these approaches and evaluate their merit within your context.
A major benefit of reviewing the research methodologies used by similar studies in your field is that you can often piggyback on the data collection techniques that other (more experienced) researchers have developed. For example, if you’re undertaking a quantitative study, you can often find tried and tested survey scales with high Cronbach’s alphas. These are usually included in the appendices of journal articles, so you don’t even have to contact the original authors. By using these, you’ll save a lot of time and ensure that your study stands on the proverbial “shoulders of giants” by using high-quality measurement instruments .
Of course, when reviewing existing literature, keep point #1 front of mind. In other words, your methodology needs to align with your research aims, objectives and questions. Don’t fall into the trap of adopting the methodological “norm” of other studies just because it’s popular. Only adopt that which is relevant to your research.
Factor #3: Practicalities
When choosing a research methodology, there will always be a tension between doing what’s theoretically best (i.e., the most scientifically rigorous research design ) and doing what’s practical , given your constraints . This is the nature of doing research and there are always trade-offs, as with anything else.
But what constraints, you ask?
When you’re evaluating your methodological options, you need to consider the following constraints:
- Data access
- Equipment and software
- Your knowledge and skills
Let’s look at each of these.
Constraint #1: Data access
The first practical constraint you need to consider is your access to data . If you’re going to be undertaking primary research , you need to think critically about the sample of respondents you realistically have access to. For example, if you plan to use in-person interviews , you need to ask yourself how many people you’ll need to interview, whether they’ll be agreeable to being interviewed, where they’re located, and so on.
If you’re wanting to undertake a quantitative approach using surveys to collect data, you’ll need to consider how many responses you’ll require to achieve statistically significant results. For many statistical tests, a sample of a few hundred respondents is typically needed to develop convincing conclusions.
So, think carefully about what data you’ll need access to, how much data you’ll need and how you’ll collect it. The last thing you want is to spend a huge amount of time on your research only to find that you can’t get access to the required data.
Constraint #2: Time
The next constraint is time. If you’re undertaking research as part of a PhD, you may have a fairly open-ended time limit, but this is unlikely to be the case for undergrad and Masters-level projects. So, pay attention to your timeline, as the data collection and analysis components of different methodologies have a major impact on time requirements . Also, keep in mind that these stages of the research often take a lot longer than originally anticipated.
Another practical implication of time limits is that it will directly impact which time horizon you can use – i.e. longitudinal vs cross-sectional . For example, if you’ve got a 6-month limit for your entire research project, it’s quite unlikely that you’ll be able to adopt a longitudinal time horizon.
Constraint #3: Money
As with so many things, money is another important constraint you’ll need to consider when deciding on your research methodology. While some research designs will cost near zero to execute, others may require a substantial budget .
Some of the costs that may arise include:
- Software costs – e.g. survey hosting services, analysis software, etc.
- Promotion costs – e.g. advertising a survey to attract respondents
- Incentive costs – e.g. providing a prize or cash payment incentive to attract respondents
- Equipment rental costs – e.g. recording equipment, lab equipment, etc.
- Travel costs
- Food & beverages
These are just a handful of costs that can creep into your research budget. Like most projects, the actual costs tend to be higher than the estimates, so be sure to err on the conservative side and expect the unexpected. It’s critically important that you’re honest with yourself about these costs, or you could end up getting stuck midway through your project because you’ve run out of money.

Constraint #4: Equipment & software
Another practical consideration is the hardware and/or software you’ll need in order to undertake your research. Of course, this variable will depend on the type of data you’re collecting and analysing. For example, you may need lab equipment to analyse substances, or you may need specific analysis software to analyse statistical data. So, be sure to think about what hardware and/or software you’ll need for each potential methodological approach, and whether you have access to these.
Constraint #5: Your knowledge and skillset
The final practical constraint is a big one. Naturally, the research process involves a lot of learning and development along the way, so you will accrue knowledge and skills as you progress. However, when considering your methodological options, you should still consider your current position on the ladder.
Some of the questions you should ask yourself are:
- Am I more of a “numbers person” or a “words person”?
- How much do I know about the analysis methods I’ll potentially use (e.g. statistical analysis)?
- How much do I know about the software and/or hardware that I’ll potentially use?
- How excited am I to learn new research skills and gain new knowledge?
- How much time do I have to learn the things I need to learn?
Answering these questions honestly will provide you with another set of criteria against which you can evaluate the research methodology options you’ve shortlisted.
So, as you can see, there is a wide range of practicalities and constraints that you need to take into account when you’re deciding on a research methodology. These practicalities create a tension between the “ideal” methodology and the methodology that you can realistically pull off. This is perfectly normal, and it’s your job to find the option that presents the best set of trade-offs.
Recap: Choosing a methodology
In this post, we’ve discussed how to go about choosing a research methodology. The three major deciding factors we looked at were:
- Exploratory
- Confirmatory
- Combination
- Research area norms
- Hardware and software
- Your knowledge and skillset
If you have any questions, feel free to leave a comment below. If you’d like a helping hand with your research methodology, check out our 1-on-1 research coaching service , or book a free consultation with a friendly Grad Coach.

Psst... there’s more!
This post was based on one of our popular Research Bootcamps . If you're working on a research project, you'll definitely want to check this out ...
You Might Also Like:

Very useful and informative especially for beginners

Nice article! I’m a beginner in the field of cybersecurity research. I am a Telecom and Network Engineer and Also aiming for PhD scholarship.

I find the article very informative especially for my decitation it has been helpful and an eye opener.

Hi I am Anna ,
I am a PHD candidate in the area of cyber security, maybe we can link up

The Examples shows by you, for sure they are really direct me and others to knows and practices the Research Design and prepration.

I found the post very informative and practical.

I struggle so much with designs of the research for sure!

I’m the process of constructing my research design and I want to know if the data analysis I plan to present in my thesis defense proposal possibly change especially after I gathered the data already.

Thank you so much this site is such a life saver. How I wish 1-1 coaching is available in our country but sadly it’s not.
Submit a Comment Cancel reply
Your email address will not be published. Required fields are marked *
Save my name, email, and website in this browser for the next time I comment.
- Print Friendly

An official website of the United States government
The .gov means it’s official. Federal government websites often end in .gov or .mil. Before sharing sensitive information, make sure you’re on a federal government site.
The site is secure. The https:// ensures that you are connecting to the official website and that any information you provide is encrypted and transmitted securely.
- Publications
- Account settings
Preview improvements coming to the PMC website in October 2024. Learn More or Try it out now .
- Advanced Search
- Journal List
- J Korean Med Sci
- v.37(16); 2022 Apr 25
A Practical Guide to Writing Quantitative and Qualitative Research Questions and Hypotheses in Scholarly Articles
Edward barroga.
1 Department of General Education, Graduate School of Nursing Science, St. Luke’s International University, Tokyo, Japan.
Glafera Janet Matanguihan
2 Department of Biological Sciences, Messiah University, Mechanicsburg, PA, USA.
The development of research questions and the subsequent hypotheses are prerequisites to defining the main research purpose and specific objectives of a study. Consequently, these objectives determine the study design and research outcome. The development of research questions is a process based on knowledge of current trends, cutting-edge studies, and technological advances in the research field. Excellent research questions are focused and require a comprehensive literature search and in-depth understanding of the problem being investigated. Initially, research questions may be written as descriptive questions which could be developed into inferential questions. These questions must be specific and concise to provide a clear foundation for developing hypotheses. Hypotheses are more formal predictions about the research outcomes. These specify the possible results that may or may not be expected regarding the relationship between groups. Thus, research questions and hypotheses clarify the main purpose and specific objectives of the study, which in turn dictate the design of the study, its direction, and outcome. Studies developed from good research questions and hypotheses will have trustworthy outcomes with wide-ranging social and health implications.
INTRODUCTION
Scientific research is usually initiated by posing evidenced-based research questions which are then explicitly restated as hypotheses. 1 , 2 The hypotheses provide directions to guide the study, solutions, explanations, and expected results. 3 , 4 Both research questions and hypotheses are essentially formulated based on conventional theories and real-world processes, which allow the inception of novel studies and the ethical testing of ideas. 5 , 6
It is crucial to have knowledge of both quantitative and qualitative research 2 as both types of research involve writing research questions and hypotheses. 7 However, these crucial elements of research are sometimes overlooked; if not overlooked, then framed without the forethought and meticulous attention it needs. Planning and careful consideration are needed when developing quantitative or qualitative research, particularly when conceptualizing research questions and hypotheses. 4
There is a continuing need to support researchers in the creation of innovative research questions and hypotheses, as well as for journal articles that carefully review these elements. 1 When research questions and hypotheses are not carefully thought of, unethical studies and poor outcomes usually ensue. Carefully formulated research questions and hypotheses define well-founded objectives, which in turn determine the appropriate design, course, and outcome of the study. This article then aims to discuss in detail the various aspects of crafting research questions and hypotheses, with the goal of guiding researchers as they develop their own. Examples from the authors and peer-reviewed scientific articles in the healthcare field are provided to illustrate key points.
DEFINITIONS AND RELATIONSHIP OF RESEARCH QUESTIONS AND HYPOTHESES
A research question is what a study aims to answer after data analysis and interpretation. The answer is written in length in the discussion section of the paper. Thus, the research question gives a preview of the different parts and variables of the study meant to address the problem posed in the research question. 1 An excellent research question clarifies the research writing while facilitating understanding of the research topic, objective, scope, and limitations of the study. 5
On the other hand, a research hypothesis is an educated statement of an expected outcome. This statement is based on background research and current knowledge. 8 , 9 The research hypothesis makes a specific prediction about a new phenomenon 10 or a formal statement on the expected relationship between an independent variable and a dependent variable. 3 , 11 It provides a tentative answer to the research question to be tested or explored. 4
Hypotheses employ reasoning to predict a theory-based outcome. 10 These can also be developed from theories by focusing on components of theories that have not yet been observed. 10 The validity of hypotheses is often based on the testability of the prediction made in a reproducible experiment. 8
Conversely, hypotheses can also be rephrased as research questions. Several hypotheses based on existing theories and knowledge may be needed to answer a research question. Developing ethical research questions and hypotheses creates a research design that has logical relationships among variables. These relationships serve as a solid foundation for the conduct of the study. 4 , 11 Haphazardly constructed research questions can result in poorly formulated hypotheses and improper study designs, leading to unreliable results. Thus, the formulations of relevant research questions and verifiable hypotheses are crucial when beginning research. 12
CHARACTERISTICS OF GOOD RESEARCH QUESTIONS AND HYPOTHESES
Excellent research questions are specific and focused. These integrate collective data and observations to confirm or refute the subsequent hypotheses. Well-constructed hypotheses are based on previous reports and verify the research context. These are realistic, in-depth, sufficiently complex, and reproducible. More importantly, these hypotheses can be addressed and tested. 13
There are several characteristics of well-developed hypotheses. Good hypotheses are 1) empirically testable 7 , 10 , 11 , 13 ; 2) backed by preliminary evidence 9 ; 3) testable by ethical research 7 , 9 ; 4) based on original ideas 9 ; 5) have evidenced-based logical reasoning 10 ; and 6) can be predicted. 11 Good hypotheses can infer ethical and positive implications, indicating the presence of a relationship or effect relevant to the research theme. 7 , 11 These are initially developed from a general theory and branch into specific hypotheses by deductive reasoning. In the absence of a theory to base the hypotheses, inductive reasoning based on specific observations or findings form more general hypotheses. 10
TYPES OF RESEARCH QUESTIONS AND HYPOTHESES
Research questions and hypotheses are developed according to the type of research, which can be broadly classified into quantitative and qualitative research. We provide a summary of the types of research questions and hypotheses under quantitative and qualitative research categories in Table 1 .
Research questions in quantitative research
In quantitative research, research questions inquire about the relationships among variables being investigated and are usually framed at the start of the study. These are precise and typically linked to the subject population, dependent and independent variables, and research design. 1 Research questions may also attempt to describe the behavior of a population in relation to one or more variables, or describe the characteristics of variables to be measured ( descriptive research questions ). 1 , 5 , 14 These questions may also aim to discover differences between groups within the context of an outcome variable ( comparative research questions ), 1 , 5 , 14 or elucidate trends and interactions among variables ( relationship research questions ). 1 , 5 We provide examples of descriptive, comparative, and relationship research questions in quantitative research in Table 2 .
Hypotheses in quantitative research
In quantitative research, hypotheses predict the expected relationships among variables. 15 Relationships among variables that can be predicted include 1) between a single dependent variable and a single independent variable ( simple hypothesis ) or 2) between two or more independent and dependent variables ( complex hypothesis ). 4 , 11 Hypotheses may also specify the expected direction to be followed and imply an intellectual commitment to a particular outcome ( directional hypothesis ) 4 . On the other hand, hypotheses may not predict the exact direction and are used in the absence of a theory, or when findings contradict previous studies ( non-directional hypothesis ). 4 In addition, hypotheses can 1) define interdependency between variables ( associative hypothesis ), 4 2) propose an effect on the dependent variable from manipulation of the independent variable ( causal hypothesis ), 4 3) state a negative relationship between two variables ( null hypothesis ), 4 , 11 , 15 4) replace the working hypothesis if rejected ( alternative hypothesis ), 15 explain the relationship of phenomena to possibly generate a theory ( working hypothesis ), 11 5) involve quantifiable variables that can be tested statistically ( statistical hypothesis ), 11 6) or express a relationship whose interlinks can be verified logically ( logical hypothesis ). 11 We provide examples of simple, complex, directional, non-directional, associative, causal, null, alternative, working, statistical, and logical hypotheses in quantitative research, as well as the definition of quantitative hypothesis-testing research in Table 3 .
Research questions in qualitative research
Unlike research questions in quantitative research, research questions in qualitative research are usually continuously reviewed and reformulated. The central question and associated subquestions are stated more than the hypotheses. 15 The central question broadly explores a complex set of factors surrounding the central phenomenon, aiming to present the varied perspectives of participants. 15
There are varied goals for which qualitative research questions are developed. These questions can function in several ways, such as to 1) identify and describe existing conditions ( contextual research question s); 2) describe a phenomenon ( descriptive research questions ); 3) assess the effectiveness of existing methods, protocols, theories, or procedures ( evaluation research questions ); 4) examine a phenomenon or analyze the reasons or relationships between subjects or phenomena ( explanatory research questions ); or 5) focus on unknown aspects of a particular topic ( exploratory research questions ). 5 In addition, some qualitative research questions provide new ideas for the development of theories and actions ( generative research questions ) or advance specific ideologies of a position ( ideological research questions ). 1 Other qualitative research questions may build on a body of existing literature and become working guidelines ( ethnographic research questions ). Research questions may also be broadly stated without specific reference to the existing literature or a typology of questions ( phenomenological research questions ), may be directed towards generating a theory of some process ( grounded theory questions ), or may address a description of the case and the emerging themes ( qualitative case study questions ). 15 We provide examples of contextual, descriptive, evaluation, explanatory, exploratory, generative, ideological, ethnographic, phenomenological, grounded theory, and qualitative case study research questions in qualitative research in Table 4 , and the definition of qualitative hypothesis-generating research in Table 5 .
Qualitative studies usually pose at least one central research question and several subquestions starting with How or What . These research questions use exploratory verbs such as explore or describe . These also focus on one central phenomenon of interest, and may mention the participants and research site. 15
Hypotheses in qualitative research
Hypotheses in qualitative research are stated in the form of a clear statement concerning the problem to be investigated. Unlike in quantitative research where hypotheses are usually developed to be tested, qualitative research can lead to both hypothesis-testing and hypothesis-generating outcomes. 2 When studies require both quantitative and qualitative research questions, this suggests an integrative process between both research methods wherein a single mixed-methods research question can be developed. 1
FRAMEWORKS FOR DEVELOPING RESEARCH QUESTIONS AND HYPOTHESES
Research questions followed by hypotheses should be developed before the start of the study. 1 , 12 , 14 It is crucial to develop feasible research questions on a topic that is interesting to both the researcher and the scientific community. This can be achieved by a meticulous review of previous and current studies to establish a novel topic. Specific areas are subsequently focused on to generate ethical research questions. The relevance of the research questions is evaluated in terms of clarity of the resulting data, specificity of the methodology, objectivity of the outcome, depth of the research, and impact of the study. 1 , 5 These aspects constitute the FINER criteria (i.e., Feasible, Interesting, Novel, Ethical, and Relevant). 1 Clarity and effectiveness are achieved if research questions meet the FINER criteria. In addition to the FINER criteria, Ratan et al. described focus, complexity, novelty, feasibility, and measurability for evaluating the effectiveness of research questions. 14
The PICOT and PEO frameworks are also used when developing research questions. 1 The following elements are addressed in these frameworks, PICOT: P-population/patients/problem, I-intervention or indicator being studied, C-comparison group, O-outcome of interest, and T-timeframe of the study; PEO: P-population being studied, E-exposure to preexisting conditions, and O-outcome of interest. 1 Research questions are also considered good if these meet the “FINERMAPS” framework: Feasible, Interesting, Novel, Ethical, Relevant, Manageable, Appropriate, Potential value/publishable, and Systematic. 14
As we indicated earlier, research questions and hypotheses that are not carefully formulated result in unethical studies or poor outcomes. To illustrate this, we provide some examples of ambiguous research question and hypotheses that result in unclear and weak research objectives in quantitative research ( Table 6 ) 16 and qualitative research ( Table 7 ) 17 , and how to transform these ambiguous research question(s) and hypothesis(es) into clear and good statements.
a These statements were composed for comparison and illustrative purposes only.
b These statements are direct quotes from Higashihara and Horiuchi. 16
a This statement is a direct quote from Shimoda et al. 17
The other statements were composed for comparison and illustrative purposes only.
CONSTRUCTING RESEARCH QUESTIONS AND HYPOTHESES
To construct effective research questions and hypotheses, it is very important to 1) clarify the background and 2) identify the research problem at the outset of the research, within a specific timeframe. 9 Then, 3) review or conduct preliminary research to collect all available knowledge about the possible research questions by studying theories and previous studies. 18 Afterwards, 4) construct research questions to investigate the research problem. Identify variables to be accessed from the research questions 4 and make operational definitions of constructs from the research problem and questions. Thereafter, 5) construct specific deductive or inductive predictions in the form of hypotheses. 4 Finally, 6) state the study aims . This general flow for constructing effective research questions and hypotheses prior to conducting research is shown in Fig. 1 .

Research questions are used more frequently in qualitative research than objectives or hypotheses. 3 These questions seek to discover, understand, explore or describe experiences by asking “What” or “How.” The questions are open-ended to elicit a description rather than to relate variables or compare groups. The questions are continually reviewed, reformulated, and changed during the qualitative study. 3 Research questions are also used more frequently in survey projects than hypotheses in experiments in quantitative research to compare variables and their relationships.
Hypotheses are constructed based on the variables identified and as an if-then statement, following the template, ‘If a specific action is taken, then a certain outcome is expected.’ At this stage, some ideas regarding expectations from the research to be conducted must be drawn. 18 Then, the variables to be manipulated (independent) and influenced (dependent) are defined. 4 Thereafter, the hypothesis is stated and refined, and reproducible data tailored to the hypothesis are identified, collected, and analyzed. 4 The hypotheses must be testable and specific, 18 and should describe the variables and their relationships, the specific group being studied, and the predicted research outcome. 18 Hypotheses construction involves a testable proposition to be deduced from theory, and independent and dependent variables to be separated and measured separately. 3 Therefore, good hypotheses must be based on good research questions constructed at the start of a study or trial. 12
In summary, research questions are constructed after establishing the background of the study. Hypotheses are then developed based on the research questions. Thus, it is crucial to have excellent research questions to generate superior hypotheses. In turn, these would determine the research objectives and the design of the study, and ultimately, the outcome of the research. 12 Algorithms for building research questions and hypotheses are shown in Fig. 2 for quantitative research and in Fig. 3 for qualitative research.

EXAMPLES OF RESEARCH QUESTIONS FROM PUBLISHED ARTICLES
- EXAMPLE 1. Descriptive research question (quantitative research)
- - Presents research variables to be assessed (distinct phenotypes and subphenotypes)
- “BACKGROUND: Since COVID-19 was identified, its clinical and biological heterogeneity has been recognized. Identifying COVID-19 phenotypes might help guide basic, clinical, and translational research efforts.
- RESEARCH QUESTION: Does the clinical spectrum of patients with COVID-19 contain distinct phenotypes and subphenotypes? ” 19
- EXAMPLE 2. Relationship research question (quantitative research)
- - Shows interactions between dependent variable (static postural control) and independent variable (peripheral visual field loss)
- “Background: Integration of visual, vestibular, and proprioceptive sensations contributes to postural control. People with peripheral visual field loss have serious postural instability. However, the directional specificity of postural stability and sensory reweighting caused by gradual peripheral visual field loss remain unclear.
- Research question: What are the effects of peripheral visual field loss on static postural control ?” 20
- EXAMPLE 3. Comparative research question (quantitative research)
- - Clarifies the difference among groups with an outcome variable (patients enrolled in COMPERA with moderate PH or severe PH in COPD) and another group without the outcome variable (patients with idiopathic pulmonary arterial hypertension (IPAH))
- “BACKGROUND: Pulmonary hypertension (PH) in COPD is a poorly investigated clinical condition.
- RESEARCH QUESTION: Which factors determine the outcome of PH in COPD?
- STUDY DESIGN AND METHODS: We analyzed the characteristics and outcome of patients enrolled in the Comparative, Prospective Registry of Newly Initiated Therapies for Pulmonary Hypertension (COMPERA) with moderate or severe PH in COPD as defined during the 6th PH World Symposium who received medical therapy for PH and compared them with patients with idiopathic pulmonary arterial hypertension (IPAH) .” 21
- EXAMPLE 4. Exploratory research question (qualitative research)
- - Explores areas that have not been fully investigated (perspectives of families and children who receive care in clinic-based child obesity treatment) to have a deeper understanding of the research problem
- “Problem: Interventions for children with obesity lead to only modest improvements in BMI and long-term outcomes, and data are limited on the perspectives of families of children with obesity in clinic-based treatment. This scoping review seeks to answer the question: What is known about the perspectives of families and children who receive care in clinic-based child obesity treatment? This review aims to explore the scope of perspectives reported by families of children with obesity who have received individualized outpatient clinic-based obesity treatment.” 22
- EXAMPLE 5. Relationship research question (quantitative research)
- - Defines interactions between dependent variable (use of ankle strategies) and independent variable (changes in muscle tone)
- “Background: To maintain an upright standing posture against external disturbances, the human body mainly employs two types of postural control strategies: “ankle strategy” and “hip strategy.” While it has been reported that the magnitude of the disturbance alters the use of postural control strategies, it has not been elucidated how the level of muscle tone, one of the crucial parameters of bodily function, determines the use of each strategy. We have previously confirmed using forward dynamics simulations of human musculoskeletal models that an increased muscle tone promotes the use of ankle strategies. The objective of the present study was to experimentally evaluate a hypothesis: an increased muscle tone promotes the use of ankle strategies. Research question: Do changes in the muscle tone affect the use of ankle strategies ?” 23
EXAMPLES OF HYPOTHESES IN PUBLISHED ARTICLES
- EXAMPLE 1. Working hypothesis (quantitative research)
- - A hypothesis that is initially accepted for further research to produce a feasible theory
- “As fever may have benefit in shortening the duration of viral illness, it is plausible to hypothesize that the antipyretic efficacy of ibuprofen may be hindering the benefits of a fever response when taken during the early stages of COVID-19 illness .” 24
- “In conclusion, it is plausible to hypothesize that the antipyretic efficacy of ibuprofen may be hindering the benefits of a fever response . The difference in perceived safety of these agents in COVID-19 illness could be related to the more potent efficacy to reduce fever with ibuprofen compared to acetaminophen. Compelling data on the benefit of fever warrant further research and review to determine when to treat or withhold ibuprofen for early stage fever for COVID-19 and other related viral illnesses .” 24
- EXAMPLE 2. Exploratory hypothesis (qualitative research)
- - Explores particular areas deeper to clarify subjective experience and develop a formal hypothesis potentially testable in a future quantitative approach
- “We hypothesized that when thinking about a past experience of help-seeking, a self distancing prompt would cause increased help-seeking intentions and more favorable help-seeking outcome expectations .” 25
- “Conclusion
- Although a priori hypotheses were not supported, further research is warranted as results indicate the potential for using self-distancing approaches to increasing help-seeking among some people with depressive symptomatology.” 25
- EXAMPLE 3. Hypothesis-generating research to establish a framework for hypothesis testing (qualitative research)
- “We hypothesize that compassionate care is beneficial for patients (better outcomes), healthcare systems and payers (lower costs), and healthcare providers (lower burnout). ” 26
- Compassionomics is the branch of knowledge and scientific study of the effects of compassionate healthcare. Our main hypotheses are that compassionate healthcare is beneficial for (1) patients, by improving clinical outcomes, (2) healthcare systems and payers, by supporting financial sustainability, and (3) HCPs, by lowering burnout and promoting resilience and well-being. The purpose of this paper is to establish a scientific framework for testing the hypotheses above . If these hypotheses are confirmed through rigorous research, compassionomics will belong in the science of evidence-based medicine, with major implications for all healthcare domains.” 26
- EXAMPLE 4. Statistical hypothesis (quantitative research)
- - An assumption is made about the relationship among several population characteristics ( gender differences in sociodemographic and clinical characteristics of adults with ADHD ). Validity is tested by statistical experiment or analysis ( chi-square test, Students t-test, and logistic regression analysis)
- “Our research investigated gender differences in sociodemographic and clinical characteristics of adults with ADHD in a Japanese clinical sample. Due to unique Japanese cultural ideals and expectations of women's behavior that are in opposition to ADHD symptoms, we hypothesized that women with ADHD experience more difficulties and present more dysfunctions than men . We tested the following hypotheses: first, women with ADHD have more comorbidities than men with ADHD; second, women with ADHD experience more social hardships than men, such as having less full-time employment and being more likely to be divorced.” 27
- “Statistical Analysis
- ( text omitted ) Between-gender comparisons were made using the chi-squared test for categorical variables and Students t-test for continuous variables…( text omitted ). A logistic regression analysis was performed for employment status, marital status, and comorbidity to evaluate the independent effects of gender on these dependent variables.” 27
EXAMPLES OF HYPOTHESIS AS WRITTEN IN PUBLISHED ARTICLES IN RELATION TO OTHER PARTS
- EXAMPLE 1. Background, hypotheses, and aims are provided
- “Pregnant women need skilled care during pregnancy and childbirth, but that skilled care is often delayed in some countries …( text omitted ). The focused antenatal care (FANC) model of WHO recommends that nurses provide information or counseling to all pregnant women …( text omitted ). Job aids are visual support materials that provide the right kind of information using graphics and words in a simple and yet effective manner. When nurses are not highly trained or have many work details to attend to, these job aids can serve as a content reminder for the nurses and can be used for educating their patients (Jennings, Yebadokpo, Affo, & Agbogbe, 2010) ( text omitted ). Importantly, additional evidence is needed to confirm how job aids can further improve the quality of ANC counseling by health workers in maternal care …( text omitted )” 28
- “ This has led us to hypothesize that the quality of ANC counseling would be better if supported by job aids. Consequently, a better quality of ANC counseling is expected to produce higher levels of awareness concerning the danger signs of pregnancy and a more favorable impression of the caring behavior of nurses .” 28
- “This study aimed to examine the differences in the responses of pregnant women to a job aid-supported intervention during ANC visit in terms of 1) their understanding of the danger signs of pregnancy and 2) their impression of the caring behaviors of nurses to pregnant women in rural Tanzania.” 28
- EXAMPLE 2. Background, hypotheses, and aims are provided
- “We conducted a two-arm randomized controlled trial (RCT) to evaluate and compare changes in salivary cortisol and oxytocin levels of first-time pregnant women between experimental and control groups. The women in the experimental group touched and held an infant for 30 min (experimental intervention protocol), whereas those in the control group watched a DVD movie of an infant (control intervention protocol). The primary outcome was salivary cortisol level and the secondary outcome was salivary oxytocin level.” 29
- “ We hypothesize that at 30 min after touching and holding an infant, the salivary cortisol level will significantly decrease and the salivary oxytocin level will increase in the experimental group compared with the control group .” 29
- EXAMPLE 3. Background, aim, and hypothesis are provided
- “In countries where the maternal mortality ratio remains high, antenatal education to increase Birth Preparedness and Complication Readiness (BPCR) is considered one of the top priorities [1]. BPCR includes birth plans during the antenatal period, such as the birthplace, birth attendant, transportation, health facility for complications, expenses, and birth materials, as well as family coordination to achieve such birth plans. In Tanzania, although increasing, only about half of all pregnant women attend an antenatal clinic more than four times [4]. Moreover, the information provided during antenatal care (ANC) is insufficient. In the resource-poor settings, antenatal group education is a potential approach because of the limited time for individual counseling at antenatal clinics.” 30
- “This study aimed to evaluate an antenatal group education program among pregnant women and their families with respect to birth-preparedness and maternal and infant outcomes in rural villages of Tanzania.” 30
- “ The study hypothesis was if Tanzanian pregnant women and their families received a family-oriented antenatal group education, they would (1) have a higher level of BPCR, (2) attend antenatal clinic four or more times, (3) give birth in a health facility, (4) have less complications of women at birth, and (5) have less complications and deaths of infants than those who did not receive the education .” 30
Research questions and hypotheses are crucial components to any type of research, whether quantitative or qualitative. These questions should be developed at the very beginning of the study. Excellent research questions lead to superior hypotheses, which, like a compass, set the direction of research, and can often determine the successful conduct of the study. Many research studies have floundered because the development of research questions and subsequent hypotheses was not given the thought and meticulous attention needed. The development of research questions and hypotheses is an iterative process based on extensive knowledge of the literature and insightful grasp of the knowledge gap. Focused, concise, and specific research questions provide a strong foundation for constructing hypotheses which serve as formal predictions about the research outcomes. Research questions and hypotheses are crucial elements of research that should not be overlooked. They should be carefully thought of and constructed when planning research. This avoids unethical studies and poor outcomes by defining well-founded objectives that determine the design, course, and outcome of the study.
Disclosure: The authors have no potential conflicts of interest to disclose.
Author Contributions:
- Conceptualization: Barroga E, Matanguihan GJ.
- Methodology: Barroga E, Matanguihan GJ.
- Writing - original draft: Barroga E, Matanguihan GJ.
- Writing - review & editing: Barroga E, Matanguihan GJ.

- Research Process
Choosing the Right Research Methodology: A Guide for Researchers
- 3 minute read
- 40.2K views
Table of Contents
Choosing an optimal research methodology is crucial for the success of any research project. The methodology you select will determine the type of data you collect, how you collect it, and how you analyse it. Understanding the different types of research methods available along with their strengths and weaknesses, is thus imperative to make an informed decision.
Understanding different research methods:
There are several research methods available depending on the type of study you are conducting, i.e., whether it is laboratory-based, clinical, epidemiological, or survey based . Some common methodologies include qualitative research, quantitative research, experimental research, survey-based research, and action research. Each method can be opted for and modified, depending on the type of research hypotheses and objectives.
Qualitative vs quantitative research:
When deciding on a research methodology, one of the key factors to consider is whether your research will be qualitative or quantitative. Qualitative research is used to understand people’s experiences, concepts, thoughts, or behaviours . Quantitative research, on the contrary, deals with numbers, graphs, and charts, and is used to test or confirm hypotheses, assumptions, and theories.
Qualitative research methodology:
Qualitative research is often used to examine issues that are not well understood, and to gather additional insights on these topics. Qualitative research methods include open-ended survey questions, observations of behaviours described through words, and reviews of literature that has explored similar theories and ideas. These methods are used to understand how language is used in real-world situations, identify common themes or overarching ideas, and describe and interpret various texts. Data analysis for qualitative research typically includes discourse analysis, thematic analysis, and textual analysis.
Quantitative research methodology:
The goal of quantitative research is to test hypotheses, confirm assumptions and theories, and determine cause-and-effect relationships. Quantitative research methods include experiments, close-ended survey questions, and countable and numbered observations. Data analysis for quantitative research relies heavily on statistical methods.
Analysing qualitative vs quantitative data:
The methods used for data analysis also differ for qualitative and quantitative research. As mentioned earlier, quantitative data is generally analysed using statistical methods and does not leave much room for speculation. It is more structured and follows a predetermined plan. In quantitative research, the researcher starts with a hypothesis and uses statistical methods to test it. Contrarily, methods used for qualitative data analysis can identify patterns and themes within the data, rather than provide statistical measures of the data. It is an iterative process, where the researcher goes back and forth trying to gauge the larger implications of the data through different perspectives and revising the analysis if required.
When to use qualitative vs quantitative research:
The choice between qualitative and quantitative research will depend on the gap that the research project aims to address, and specific objectives of the study. If the goal is to establish facts about a subject or topic, quantitative research is an appropriate choice. However, if the goal is to understand people’s experiences or perspectives, qualitative research may be more suitable.
Conclusion:
In conclusion, an understanding of the different research methods available, their applicability, advantages, and disadvantages is essential for making an informed decision on the best methodology for your project. If you need any additional guidance on which research methodology to opt for, you can head over to Elsevier Author Services (EAS). EAS experts will guide you throughout the process and help you choose the perfect methodology for your research goals.

Why is data validation important in research?

When Data Speak, Listen: Importance of Data Collection and Analysis Methods
You may also like.

Descriptive Research Design and Its Myriad Uses

Five Common Mistakes to Avoid When Writing a Biomedical Research Paper

Making Technical Writing in Environmental Engineering Accessible

To Err is Not Human: The Dangers of AI-assisted Academic Writing

Writing a good review article

Scholarly Sources: What are They and Where can You Find Them?
Input your search keywords and press Enter.
- USC Libraries
- Research Guides
Organizing Your Social Sciences Research Paper
- Quantitative Methods
- Purpose of Guide
- Design Flaws to Avoid
- Independent and Dependent Variables
- Glossary of Research Terms
- Reading Research Effectively
- Narrowing a Topic Idea
- Broadening a Topic Idea
- Extending the Timeliness of a Topic Idea
- Academic Writing Style
- Applying Critical Thinking
- Choosing a Title
- Making an Outline
- Paragraph Development
- Research Process Video Series
- Executive Summary
- The C.A.R.S. Model
- Background Information
- The Research Problem/Question
- Theoretical Framework
- Citation Tracking
- Content Alert Services
- Evaluating Sources
- Primary Sources
- Secondary Sources
- Tiertiary Sources
- Scholarly vs. Popular Publications
- Qualitative Methods
- Insiderness
- Using Non-Textual Elements
- Limitations of the Study
- Common Grammar Mistakes
- Writing Concisely
- Avoiding Plagiarism
- Footnotes or Endnotes?
- Further Readings
- Generative AI and Writing
- USC Libraries Tutorials and Other Guides
- Bibliography
Quantitative methods emphasize objective measurements and the statistical, mathematical, or numerical analysis of data collected through polls, questionnaires, and surveys, or by manipulating pre-existing statistical data using computational techniques . Quantitative research focuses on gathering numerical data and generalizing it across groups of people or to explain a particular phenomenon.
Babbie, Earl R. The Practice of Social Research . 12th ed. Belmont, CA: Wadsworth Cengage, 2010; Muijs, Daniel. Doing Quantitative Research in Education with SPSS . 2nd edition. London: SAGE Publications, 2010.
Need Help Locating Statistics?
Resources for locating data and statistics can be found here:
Statistics & Data Research Guide
Characteristics of Quantitative Research
Your goal in conducting quantitative research study is to determine the relationship between one thing [an independent variable] and another [a dependent or outcome variable] within a population. Quantitative research designs are either descriptive [subjects usually measured once] or experimental [subjects measured before and after a treatment]. A descriptive study establishes only associations between variables; an experimental study establishes causality.
Quantitative research deals in numbers, logic, and an objective stance. Quantitative research focuses on numeric and unchanging data and detailed, convergent reasoning rather than divergent reasoning [i.e., the generation of a variety of ideas about a research problem in a spontaneous, free-flowing manner].
Its main characteristics are :
- The data is usually gathered using structured research instruments.
- The results are based on larger sample sizes that are representative of the population.
- The research study can usually be replicated or repeated, given its high reliability.
- Researcher has a clearly defined research question to which objective answers are sought.
- All aspects of the study are carefully designed before data is collected.
- Data are in the form of numbers and statistics, often arranged in tables, charts, figures, or other non-textual forms.
- Project can be used to generalize concepts more widely, predict future results, or investigate causal relationships.
- Researcher uses tools, such as questionnaires or computer software, to collect numerical data.
The overarching aim of a quantitative research study is to classify features, count them, and construct statistical models in an attempt to explain what is observed.
Things to keep in mind when reporting the results of a study using quantitative methods :
- Explain the data collected and their statistical treatment as well as all relevant results in relation to the research problem you are investigating. Interpretation of results is not appropriate in this section.
- Report unanticipated events that occurred during your data collection. Explain how the actual analysis differs from the planned analysis. Explain your handling of missing data and why any missing data does not undermine the validity of your analysis.
- Explain the techniques you used to "clean" your data set.
- Choose a minimally sufficient statistical procedure ; provide a rationale for its use and a reference for it. Specify any computer programs used.
- Describe the assumptions for each procedure and the steps you took to ensure that they were not violated.
- When using inferential statistics , provide the descriptive statistics, confidence intervals, and sample sizes for each variable as well as the value of the test statistic, its direction, the degrees of freedom, and the significance level [report the actual p value].
- Avoid inferring causality , particularly in nonrandomized designs or without further experimentation.
- Use tables to provide exact values ; use figures to convey global effects. Keep figures small in size; include graphic representations of confidence intervals whenever possible.
- Always tell the reader what to look for in tables and figures .
NOTE: When using pre-existing statistical data gathered and made available by anyone other than yourself [e.g., government agency], you still must report on the methods that were used to gather the data and describe any missing data that exists and, if there is any, provide a clear explanation why the missing data does not undermine the validity of your final analysis.
Babbie, Earl R. The Practice of Social Research . 12th ed. Belmont, CA: Wadsworth Cengage, 2010; Brians, Craig Leonard et al. Empirical Political Analysis: Quantitative and Qualitative Research Methods . 8th ed. Boston, MA: Longman, 2011; McNabb, David E. Research Methods in Public Administration and Nonprofit Management: Quantitative and Qualitative Approaches . 2nd ed. Armonk, NY: M.E. Sharpe, 2008; Quantitative Research Methods. Writing@CSU. Colorado State University; Singh, Kultar. Quantitative Social Research Methods . Los Angeles, CA: Sage, 2007.
Basic Research Design for Quantitative Studies
Before designing a quantitative research study, you must decide whether it will be descriptive or experimental because this will dictate how you gather, analyze, and interpret the results. A descriptive study is governed by the following rules: subjects are generally measured once; the intention is to only establish associations between variables; and, the study may include a sample population of hundreds or thousands of subjects to ensure that a valid estimate of a generalized relationship between variables has been obtained. An experimental design includes subjects measured before and after a particular treatment, the sample population may be very small and purposefully chosen, and it is intended to establish causality between variables. Introduction The introduction to a quantitative study is usually written in the present tense and from the third person point of view. It covers the following information:
- Identifies the research problem -- as with any academic study, you must state clearly and concisely the research problem being investigated.
- Reviews the literature -- review scholarship on the topic, synthesizing key themes and, if necessary, noting studies that have used similar methods of inquiry and analysis. Note where key gaps exist and how your study helps to fill these gaps or clarifies existing knowledge.
- Describes the theoretical framework -- provide an outline of the theory or hypothesis underpinning your study. If necessary, define unfamiliar or complex terms, concepts, or ideas and provide the appropriate background information to place the research problem in proper context [e.g., historical, cultural, economic, etc.].
Methodology The methods section of a quantitative study should describe how each objective of your study will be achieved. Be sure to provide enough detail to enable the reader can make an informed assessment of the methods being used to obtain results associated with the research problem. The methods section should be presented in the past tense.
- Study population and sampling -- where did the data come from; how robust is it; note where gaps exist or what was excluded. Note the procedures used for their selection;
- Data collection – describe the tools and methods used to collect information and identify the variables being measured; describe the methods used to obtain the data; and, note if the data was pre-existing [i.e., government data] or you gathered it yourself. If you gathered it yourself, describe what type of instrument you used and why. Note that no data set is perfect--describe any limitations in methods of gathering data.
- Data analysis -- describe the procedures for processing and analyzing the data. If appropriate, describe the specific instruments of analysis used to study each research objective, including mathematical techniques and the type of computer software used to manipulate the data.
Results The finding of your study should be written objectively and in a succinct and precise format. In quantitative studies, it is common to use graphs, tables, charts, and other non-textual elements to help the reader understand the data. Make sure that non-textual elements do not stand in isolation from the text but are being used to supplement the overall description of the results and to help clarify key points being made. Further information about how to effectively present data using charts and graphs can be found here .
- Statistical analysis -- how did you analyze the data? What were the key findings from the data? The findings should be present in a logical, sequential order. Describe but do not interpret these trends or negative results; save that for the discussion section. The results should be presented in the past tense.
Discussion Discussions should be analytic, logical, and comprehensive. The discussion should meld together your findings in relation to those identified in the literature review, and placed within the context of the theoretical framework underpinning the study. The discussion should be presented in the present tense.
- Interpretation of results -- reiterate the research problem being investigated and compare and contrast the findings with the research questions underlying the study. Did they affirm predicted outcomes or did the data refute it?
- Description of trends, comparison of groups, or relationships among variables -- describe any trends that emerged from your analysis and explain all unanticipated and statistical insignificant findings.
- Discussion of implications – what is the meaning of your results? Highlight key findings based on the overall results and note findings that you believe are important. How have the results helped fill gaps in understanding the research problem?
- Limitations -- describe any limitations or unavoidable bias in your study and, if necessary, note why these limitations did not inhibit effective interpretation of the results.
Conclusion End your study by to summarizing the topic and provide a final comment and assessment of the study.
- Summary of findings – synthesize the answers to your research questions. Do not report any statistical data here; just provide a narrative summary of the key findings and describe what was learned that you did not know before conducting the study.
- Recommendations – if appropriate to the aim of the assignment, tie key findings with policy recommendations or actions to be taken in practice.
- Future research – note the need for future research linked to your study’s limitations or to any remaining gaps in the literature that were not addressed in your study.
Black, Thomas R. Doing Quantitative Research in the Social Sciences: An Integrated Approach to Research Design, Measurement and Statistics . London: Sage, 1999; Gay,L. R. and Peter Airasain. Educational Research: Competencies for Analysis and Applications . 7th edition. Upper Saddle River, NJ: Merril Prentice Hall, 2003; Hector, Anestine. An Overview of Quantitative Research in Composition and TESOL . Department of English, Indiana University of Pennsylvania; Hopkins, Will G. “Quantitative Research Design.” Sportscience 4, 1 (2000); "A Strategy for Writing Up Research Results. The Structure, Format, Content, and Style of a Journal-Style Scientific Paper." Department of Biology. Bates College; Nenty, H. Johnson. "Writing a Quantitative Research Thesis." International Journal of Educational Science 1 (2009): 19-32; Ouyang, Ronghua (John). Basic Inquiry of Quantitative Research . Kennesaw State University.
Strengths of Using Quantitative Methods
Quantitative researchers try to recognize and isolate specific variables contained within the study framework, seek correlation, relationships and causality, and attempt to control the environment in which the data is collected to avoid the risk of variables, other than the one being studied, accounting for the relationships identified.
Among the specific strengths of using quantitative methods to study social science research problems:
- Allows for a broader study, involving a greater number of subjects, and enhancing the generalization of the results;
- Allows for greater objectivity and accuracy of results. Generally, quantitative methods are designed to provide summaries of data that support generalizations about the phenomenon under study. In order to accomplish this, quantitative research usually involves few variables and many cases, and employs prescribed procedures to ensure validity and reliability;
- Applying well established standards means that the research can be replicated, and then analyzed and compared with similar studies;
- You can summarize vast sources of information and make comparisons across categories and over time; and,
- Personal bias can be avoided by keeping a 'distance' from participating subjects and using accepted computational techniques .
Babbie, Earl R. The Practice of Social Research . 12th ed. Belmont, CA: Wadsworth Cengage, 2010; Brians, Craig Leonard et al. Empirical Political Analysis: Quantitative and Qualitative Research Methods . 8th ed. Boston, MA: Longman, 2011; McNabb, David E. Research Methods in Public Administration and Nonprofit Management: Quantitative and Qualitative Approaches . 2nd ed. Armonk, NY: M.E. Sharpe, 2008; Singh, Kultar. Quantitative Social Research Methods . Los Angeles, CA: Sage, 2007.
Limitations of Using Quantitative Methods
Quantitative methods presume to have an objective approach to studying research problems, where data is controlled and measured, to address the accumulation of facts, and to determine the causes of behavior. As a consequence, the results of quantitative research may be statistically significant but are often humanly insignificant.
Some specific limitations associated with using quantitative methods to study research problems in the social sciences include:
- Quantitative data is more efficient and able to test hypotheses, but may miss contextual detail;
- Uses a static and rigid approach and so employs an inflexible process of discovery;
- The development of standard questions by researchers can lead to "structural bias" and false representation, where the data actually reflects the view of the researcher instead of the participating subject;
- Results provide less detail on behavior, attitudes, and motivation;
- Researcher may collect a much narrower and sometimes superficial dataset;
- Results are limited as they provide numerical descriptions rather than detailed narrative and generally provide less elaborate accounts of human perception;
- The research is often carried out in an unnatural, artificial environment so that a level of control can be applied to the exercise. This level of control might not normally be in place in the real world thus yielding "laboratory results" as opposed to "real world results"; and,
- Preset answers will not necessarily reflect how people really feel about a subject and, in some cases, might just be the closest match to the preconceived hypothesis.
Research Tip
Finding Examples of How to Apply Different Types of Research Methods
SAGE publications is a major publisher of studies about how to design and conduct research in the social and behavioral sciences. Their SAGE Research Methods Online and Cases database includes contents from books, articles, encyclopedias, handbooks, and videos covering social science research design and methods including the complete Little Green Book Series of Quantitative Applications in the Social Sciences and the Little Blue Book Series of Qualitative Research techniques. The database also includes case studies outlining the research methods used in real research projects. This is an excellent source for finding definitions of key terms and descriptions of research design and practice, techniques of data gathering, analysis, and reporting, and information about theories of research [e.g., grounded theory]. The database covers both qualitative and quantitative research methods as well as mixed methods approaches to conducting research.
SAGE Research Methods Online and Cases
- << Previous: Qualitative Methods
- Next: Insiderness >>
- Last Updated: May 30, 2024 9:38 AM
- URL: https://libguides.usc.edu/writingguide
Selecting a Research Topic: Overview
- Refine your topic
- Background information & facts
- Writing help
Here are some resources to refer to when selecting a topic and preparing to write a paper:
- MIT Writing and Communication Center "Providing free professional advice about all types of writing and speaking to all members of the MIT community."
- Search Our Collections Find books about writing. Search by subject for: english language grammar; report writing handbooks; technical writing handbooks
- Blue Book of Grammar and Punctuation Online version of the book that provides examples and tips on grammar, punctuation, capitalization, and other writing rules.
- Select a topic
Choosing an interesting research topic is your first challenge. Here are some tips:
- Choose a topic that you are interested in! The research process is more relevant if you care about your topic.
- If your topic is too broad, you will find too much information and not be able to focus.
- Background reading can help you choose and limit the scope of your topic.
- Review the guidelines on topic selection outlined in your assignment. Ask your professor or TA for suggestions.
- Refer to lecture notes and required texts to refresh your knowledge of the course and assignment.
- Talk about research ideas with a friend. S/he may be able to help focus your topic by discussing issues that didn't occur to you at first.
- WHY did you choose the topic? What interests you about it? Do you have an opinion about the issues involved?
- WHO are the information providers on this topic? Who might publish information about it? Who is affected by the topic? Do you know of organizations or institutions affiliated with the topic?
- WHAT are the major questions for this topic? Is there a debate about the topic? Are there a range of issues and viewpoints to consider?
- WHERE is your topic important: at the local, national or international level? Are there specific places affected by the topic?
- WHEN is/was your topic important? Is it a current event or an historical issue? Do you want to compare your topic by time periods?
Table of contents
- Broaden your topic
- Information Navigator home
- Sources for facts - general
- Sources for facts - specific subjects
Start here for help
Ask Us Ask a question, make an appointment, give feedback, or visit us.
- Next: Refine your topic >>
- Last Updated: Jul 30, 2021 2:50 PM
- URL: https://libguides.mit.edu/select-topic
Key Concepts in Quantitative Research
In this module, we are going to explore the nuances of quantitative research, including the main types of quantitative research, more exploration into variables (including confounding and extraneous variables), and causation.
Content includes:
- Flaws, “Proof”, and Rigor
- The Steps of Quantitative Methodology
- Major Classes of Quantitative Research
- Experimental versus Non-Experimental Research
- Types of Experimental Research
- Types of Non-Experimental Research
- Research Variables
- Confounding/Extraneous Variables
- Causation versus correlation/association
Objectives:
- Discuss the flaws, proof, and rigor in research.
- Describe the differences between independent variables and dependent variables.
- Describe the steps in quantitative research methodology.
- Describe experimental, quasi-experimental, and non-experimental research studies
- Describe confounding and extraneous variables.
- Differentiate cause-and-effect (causality) versus association/correlation
Flaws, Proof, and Rigor in Research
One of the biggest hurdles that students and seasoned researchers alike struggle to grasp, is that research cannot “ prove ” nor “ disprove ”. Research can only support a hypothesis with reasonable, statistically significant evidence.
Indeed. You’ve heard it incorrectly your entire life. You will hear professors, scientists, radio ads, podcasts, and even researchers comment something to the effect of, “It has been proven that…” or “Research proves that…” or “Finally! There is proof that…”
We have been duped. Consider the “ prove ” word a very bad word in this course. The forbidden “P” word. Do not say it, write it, allude to it, or repeat it. And, for the love of avocados and all things fluffy, do not include the “P” word on your EBP poster. You will be deducted some major points.
We can only conclude with reasonable certainty through statistical analyses that there is a high probability that something did not happen by chance but instead happened due to the intervention that the researcher tested. Got that? We will come back to that concept but for now know that it is called “statistical significance”.
All research has flaws. We might not know what those flaws are, but we will be learning about confounding and extraneous variables later on in this module to help explain how flaws can happen.
Remember this: Sometimes, the researcher might not even know that there was a flaw that occurred. No research project is perfect. There is no 100% awesome. This is a major reason why it is so important to be able to duplicate a research project and obtain similar results. The more we can duplicate research with the same exact methodology and protocols, the more certainty we have in the results and we can start accounting for flaws that may have sneaked in.
Finally, not all research is equal. Some research is done very sloppily, and other research has a very high standard of rigor. How do we know which is which when reading an article? Well, within this module, we will start learning about some things to look for in a published research article to help determine rigor. We do not want lazy research to determine our actions as nurses, right? We want the strongest, most reliable, most valid, most rigorous research evidence possible so that we can take those results and embed them into patient care. Who wants shoddy evidence determining the actions we take with your grandmother’s heart surgery?
Independent Variables and Dependent Variables
As we were already introduced to, there are measures called “variables” in research. This will be a bit of a review but it is important to bring up again, as it is a hallmark of quantitative research. In quantitative studies, the concepts being measured are called variables (AKA: something that varies). Variables are something that can change – either by manipulation or from something causing a change. In the article snapshots that we have looked at, researchers are trying to find causes for phenomena. Does a nursing intervention cause an improvement in patient outcomes? Does the cholesterol medication cause a decrease in cholesterol level? Does smoking cause cancer?
The presumed cause is called the independent variable. The presumed effect is called the dependent variable. The dependent variable is “dependent” on something causing it to change. The dependent variable is the outcome that a researcher is trying to understand, explain, or predict.
Think back to our PICO questions. You can think of the intervention (I) as the independent variable and the outcome (O) as the dependent variable.
The independent variable is manipulated by the researcher or can be variants of influence. Whereas the dependent variable is never manipulated.

Variables do not always measure cause-and-effect. They can also measure a direction of influence.
Here is an example of that: If we compared levels of depression among men and women diagnosed with pancreatic cancer and found men to be more depressed, we cannot conclude that depression was caused by gender. However, we can note that the direction of influence clearly runs from gender to depression. It makes no sense to suggest the depression influenced their gender.
In the above example, what is the independent variable (IV) and what is the dependent variable (DV)? If you guessed gender as the IV and depression as the DV, you are correct! Important to note in this case that the researcher did not manipulate the IV, but the IV is manipulated on its own (male or female).
Researchers do not always have just one IV. In some cases, more than one IV may be measured. Take, for instance, a study that wants to measure the factors that influence one’s study habits. Independent variables of gender, sleep habits, and hours of work may be considered. Likewise, multiple DVs can be measured. For example, perhaps we want to measure weight and abdominal girth on a plant-based diet (IV).
Now, some studies do not have an intervention. We will come back to that when we talk about non-experimental research.
The point of variables is so that researchers have a very specific measurement that they seek to study.
Let’s look at a couple of examples:
Now you try! Identify the IVs and DVs:
IV and DV Case Studies (Leibold, 2020)
Case Three: Independent variable: Healthy Lifestyle education with a focus on physical activity; Dependent variable: Physical activity rate before and after education intervention, Heart rate before and after education intervention, Blood pressures before and after education intervention.
Case Four: Independent variable: Playing classical music; Dependent variable: Grade point averages post classical music, compared to pre-classical music.
Case Five: Independent variable: No independent variable as there is no intervention. Dependent variable: The themes that emerge from the qualitative data.
The Steps in Quantitative Research Methodology
Now, as we learned in the last module, quantitative research is completely objective. There is no subjectivity to it. Why is this? Well, as we have learned, the purpose of quantitative research is to make an inference about the results in order to generalize these results to the population.
In quantitative studies, there is a very systematic approach that moves from the beginning point of the study (writing a research question) to the end point (obtaining an answer). This is a very linear and purposeful flow across the study, and all quantitative research should follow the same sequence.
- Identifying a problem and formulating a research question . Quantitative research begins with a theory . As in, “something is wrong and we want to fix it or improve it”. Think back to when we discussed research problems and formulating a research question. Here we are! That is the first step in formulating a quantitative research plan.
- Formulate a hypothesis . This step is key. Researchers need to know exactly what they are testing so that testing the hypothesis can be achieved through specific statistical analyses.
- A thorough literature review . At this step, researchers strive to understand what is already known about a topic and what evidence already exists.
- Identifying a framework . When an appropriate framework is identified, the findings of a study may have broader significance and utility (Polit & Beck, 2021).
- Choosing a study design . The research design will determine exactly how the researcher will obtain the answers to the research question(s). The entire design needs to be structured and controlled, with the overarching goal of minimizing bias and errors. The design determines what data will be collected and how, how often data will be collected, what types of comparisons will be made. You can think of the study design as the architectural backbone of the entire study.
- Sampling . The researcher needs to determine a subset of the population that is to be studied. We will come back to the sampling concept in the next module. However, the goal of sampling is to choose a subset of the population that adequate reflects the population of interest.
- I nstruments to be used to collect data (with reliability and validity as a priority). Researchers must find a way to measure the research variables (intervention and outcome) accurately. The task of measuring is complex and challenging, as data needs to be collected reliably (measuring consistently each time) and valid. Reliability and validity are both about how well a method measures something. The next module will cover this in detail.
- Obtaining approval for ethical/legal human rights procedures . As we will learn in an upcoming module, there needs to be methods in place to safeguard human rights.
- Data collection . The fun part! Finally, after everything has been organized and planned, the researcher(s) begin to collect data. The pre-established plan (methodology) determines when data collection begins, how to accomplish it, how data collection staff will be trained, and how data will be recorded.
- Data analysis . Here comes the statistical analyses. The next module will dive into this.
- Discussion . After all the analyses have been complete, the researcher then needs to interpret the results and examine the implications. Researchers attempt to explain the findings in light of the theoretical framework, prior evidence, theory, clinical experience, and any limitations in the study now that it has been completed. Often, the researcher discusses not just the statistical significance, but also the clinical significance, as it is common to have one without the other.
- Summary/references . Part of the final steps of any research project is to disseminate (AKA: share) the findings. This may be in a published article, conference, poster session, etc. The point of this step is to communicate to others the information found through the study. All references are collected so that the researchers can give credit to others.
- Budget and funding . As a last mention in the overall steps, budget and funding for research is a consideration. Research can be expensive. Often, researchers can obtain a grant or other funding to help offset the costs.
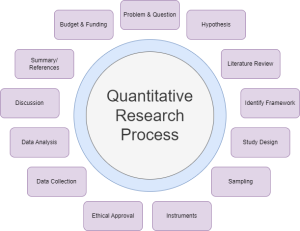
Edit: Steps in Quantitative Research video. Step 12 should say “Dissemination” (sharing the results).
Experimental, Quasi-Experimental, and Non-Experimental Studies
To start this section, please watch this wonderful video by Jenny Barrow, MSN, RN, CNE, that explains experimental versus nonexperimental research.
(Jenny Barrow, 2019)
Now that you have that overview, continue reading this module.
Experimental Research : In experimental research, the researcher is seeking to draw a conclusion between an independent variable and a dependent variable. This design attempts to establish cause-effect relationships among the variables. You could think of experimental research as experimenting with “something” to see if it caused “something else”.
A true experiment is called a Randomized Controlled Trial (or RCT). An RCT is at the top of the echelon as far as quantitative experimental research. It’s the gold standard of scientific research. An RCT, a true experimental design, must have 3 features:
- An intervention : The experiment does something to the participants by the option of manipulating the independent variable.
- Control : Some participants in the study receive either the standard care, or no intervention at all. This is also called the counterfactual – meaning, it shows what would happen if no intervention was introduced.
- Randomization : Randomization happens when the researcher makes sure that it is completely random who receives the intervention and who receives the control. The purpose is to make the groups equal regarding all other factors except receipt of the intervention.
Note: There is a lot of confusion with students (and even some researchers!) when they refer to “ random assignment ” versus “ random sampling ”. Random assignment is a signature of a true experiment. This means that if participants are not truly randomly assigned to intervention groups, then it is not a true experiment. We will talk more about random sampling in the next module.
One very common method for RCT’s is called a pretest-posttest design . This is when the researcher measures the outcome before and after the intervention. For example, if the researcher had an IV (intervention/treatment) of a pain medication, the DV (pain) would be measured before the intervention is given and after it is given. The control group may just receive a placebo. This design permits the researcher to see if the change in pain was caused by the pain medication because only some people received it (Polit & Beck, 2021).
Another experimental design is called a crossover design . This type of design involves exposing participants to more than one treatment. For example, subject 1 first receives treatment A, then treatment B, then treatment C. Subject 2 might first receive treatment B, then treatment A, and then treatment C. In this type of study, the three conditions for an experiment are met: Intervention, randomization, and control – with the subjects serving as their own control group.
Control group conditions can be done in 4 ways:
- No intervention is used; control group gets no treatment at all
- “Usual care” or standard of care or normal procedures used
- An alternative intervention is uses (e.g. auditory versus visual stimulation)
- A placebo or pseudo-intervention, presumed to have no therapeutic value, is used
Quasi-Experimental Research : Quasi-experiments involve an experiment just like true experimental research. However, they lack randomization and some even lack a control group. Therefore, there is implementation and testing of an intervention, but there is an absence of randomization.
For example, perhaps we wanted to measure the effect of yoga for nursing students. The IV (intervention of yoga) is being offered to all nursing students and therefore randomization is not possible. For comparison, we could measure quality of life data on nursing students at a different university. Data is collected from both groups at baseline and then again after the yoga classes. Note, that in quasi-experiments, the phrase “comparison group” is sometimes used instead of “control group” against which outcome measures are collected.
Sometimes there is no comparison group either. This would be called a one-group pretest-posttest design .
Non-Experimental Research : Sometimes, cause-problem research questions cannot be answered with an experimental or quasi-experimental design because the IV cannot be manipulated. For example, if we want to measure what impact prerequisite grades have on student success in nursing programs, we obviously cannot manipulate the prerequisite grades. In another example, if we wanted to investigate how low birth weight impacts developmental progression in children, we cannot manipulate the birth weight. Often, you will see the word “observational” in lieu of non-experimental researcher. This does not mean the researcher is just standing and watching people, but instead it refers to the method of observing data that has already been established without manipulation.
There are various types of non-experimental research:
Correlational research : A correlational research design investigates relationships between two variables (or more) without the researcher controlling or manipulating any of them. In the example of prerequisites and nursing program success, that is a correlational design. Consider hypothetically, a researcher is studying a correlation between cancer and marriage. In this study, there are two variables: disease and marriage. Let us say marriage has a negative association with cancer. This means that married people are less likely to develop cancer.
Cohort design (also called a prospective design) : In a cohort study, the participants do not have the outcome of interest to begin with. They are selected based on the exposure status of the individual. They are then followed over time to evaluate for the occurrence of the outcome of interest. Cohorts may be divided into exposure categories once baseline measurements of a defined population are made. For example, the Framingham Cardiovascular Disease Study (CVD) used baseline measurements to divide the population into categories of CVD risk factors. Another example: An example of a cohort study is comparing the test scores of one group of people who underwent extensive tutoring and a special curriculum and those who did not receive any extra help. The group could be studied for years to assess whether their scores improve over time and at what rate.
Retrospective design : In retrospective studies, the outcome of interest has already occurred (or not occurred – e.g., in controls) in each individual by the time s/he is enrolled, and the data are collected either from records or by asking participants to recall exposures. There is no follow-up of participants. For example, a researcher might examine the medical histories of 1000 elderly women to identify the causes of health problems.
Case-control design : A study that compares two groups of people: those with the disease or condition under study (cases) and a very similar group of people who do not have the condition. For example, investigators conducted a case-control study to determine if there is an association between colon cancer and a high fat diet. Cases were all confirmed colon cancer cases in North Carolina in 2010. Controls were a sample of North Carolina residents without colon cancer.
Descriptive research : Descriptive research design is a type of research design that aims to obtain information to systematically describe a phenomenon, situation, or population. More specifically, it helps answer the what, when, where, and how questions regarding the research problem, rather than the why. For example, the researcher might wish to discover the percentage of motorists who tailgate – the prevalence of a certain behavior.
There are two other designs to mention, which are both on a time continuum basis.
Cross-sectional design : All data are collected at a single point in time. Retrospective studies are usually cross-sectional. The IV usually concerns events or behaviors occurring in the past. One cross-sectional study example in medicine is a data collection of smoking habits and lung cancer incidence in a given population. A cross-sectional study like this cannot solely determine that smoking habits cause lung cancer, but it can suggest a relationship that merits further investigation. Cross-sectional studies serve many purposes, and the cross-sectional design is the most relevant design when assessing the prevalence of disease, attitudes and knowledge among patients and health personnel, in validation studies comparing, for example, different measurement instruments, and in reliability studies.
Longitudinal design : Data are collected two or more times over an extended period. Longitudinal designs are better at showing patterns of change and at clarifying whether a cause occurred before an effect (outcome). A challenge in longitudinal studies is attrition or the loss of participants over time. In a longitudinal study subjects are followed over time with continuous or repeated monitoring of risk factors or health outcomes, or both. Such investigations vary enormously in their size and complexity. At one extreme a large population may be studied over decades. An example of a longitudinal design is a multiyear comparative study of the same children in an urban and a suburban school to record their cognitive development in depth.
Confounding and Extraneous Variables
Confounding variables are a type of extraneous variable that occur which interfere with or influence the relationship between the independent and dependent variables. In research that investigates a potential cause-and-effect relationship, a confounding variable is an unmeasured third variable that influences both the supposed cause and the supposed effect.
It’s important to consider potential confounding variables and account for them in research designs to ensure results are valid. You can imagine that if something sneaks in to influence the measured variables, it can really muck up the study!
Here is an example:
You collect data on sunburns and ice cream consumption. You find that higher ice cream consumption is associated with a higher probability of sunburn. Does that mean ice cream consumption causes sunburn?
Here, the confounding variable is temperature: hot temperatures cause people to both eat more ice cream and spend more time outdoors under the sun, resulting in more sunburns.

To ensure the internal validity of research, the researcher must account for confounding variables. If he/she fails to do so, the results may not reflect the actual relationship between the variables that they are interested in.
For instance, they may find a cause-and-effect relationship that does not actually exist, because the effect they measure is caused by the confounding variable (and not by the independent variable).
Here is another example:
The researcher finds that babies born to mothers who smoked during their pregnancies weigh significantly less than those born to non-smoking mothers. However, if the researcher does not account for the fact that smokers are more likely to engage in other unhealthy behaviors, such as drinking or eating less healthy foods, then he/she might overestimate the relationship between smoking and low birth weight.
Extraneous variables are any variables that the researcher is not investigating that can potentially affect the outcomes of the research study. If left uncontrolled, extraneous variables can lead to inaccurate conclusions about the relationship between IVs and DVs.
Extraneous variables can threaten the internal validity of a study by providing alternative explanations for the results. In an experiment, the researcher manipulates an independent variable to study its effects on a dependent variable.
In a study on mental performance, the researcher tests whether wearing a white lab coat, the independent variable (IV), improves scientific reasoning, the dependent variable (DV).
Students from a university are recruited to participate in the study. The researcher manipulates the independent variable by splitting participants into two groups:
- Participants in the experimental group are asked to wear a lab coat during the study.
- Participants in the control group are asked to wear a casual coat during the study.
All participants are given a scientific knowledge quiz, and their scores are compared between groups.
When extraneous variables are uncontrolled, it’s hard to determine the exact effects of the independent variable on the dependent variable, because the effects of extraneous variables may mask them.
Uncontrolled extraneous variables can also make it seem as though there is a true effect of the independent variable in an experiment when there’s actually none.
In the above experiment example, these extraneous variables can affect the science knowledge scores:
- Participant’s major (e.g., STEM or humanities)
- Participant’s interest in science
- Demographic variables such as gender or educational background
- Time of day of testing
- Experiment environment or setting
If these variables systematically differ between the groups, you can’t be sure whether your results come from your independent variable manipulation or from the extraneous variables.
In summary, an extraneous variable is anything that could influence the dependent variable. A confounding variable influences the dependent variable, and also correlates with or causally affects the independent variable.

Cause-and-Effect (Causality) Versus Association/Correlation
A very important concept to understand is cause-and-effect, also known as causality, versus correlation. Let’s look at these two concepts in very simplified statements. Causation means that one thing caused another thing to happen. Correlation means there is some association between the two thing we are measuring.
It would be nice if it were as simple as that. These two concepts can indeed by confused by many. Let’s dive deeper.
Two or more variables are considered to be related or associated, in a statistical context, if their values change so that as the value of one variable increases or decreases so does the value of the other variable (or the opposite direction).
For example, for the two variables of “hours worked” and “income earned”, there is a relationship between the two if the increase in hours is associated with an increase in income earned.
However, correlation is a statistical measure that describes the size and direction of a relationship between two or more variables. A correlation does not automatically mean that the change in one variable caused the change in value in the other variable.
Theoretically, the difference between the two types of relationships is easy to identify — an action or occurrence can cause another (e.g. smoking causes an increase in the risk of developing lung cancer), or it can correlate with another (e.g. smoking is correlated with alcoholism, but it does not cause alcoholism). In practice, however, it remains difficult to clearly establish cause and effect, compared with establishing correlation.
Simplified in this image, we can say that hot and sunny weather causes an increase in ice cream consumption. Similarly, we can demise that hot and sunny weather increases the incidence of sunburns. However, we cannot say that ice cream caused a sunburn (or that a sunburn increases consumption of ice cream). It is purely coincidental. In this example, it is pretty easy to anecdotally surmise correlation versus causation. However, in research, we have statistical tests that help researchers differentiate via specialized analyses.

Here is a great Khan Academy video of about 5 minutes that shows a worked example of correlation versus causation with regard to sledding accidents and frostbite cases:
https://www.khanacademy.org/test-prep/praxis-math/praxis-math-lessons/gtp–praxis-math–lessons–statistics-and-probability/v/gtp–praxis-math–video–correlation-and-causation
References & Attribution
“ Light bulb doodle ” by rawpixel licensed CC0 .
“ Magnifying glass ” by rawpixel licensed CC0
“ Orange flame ” by rawpixel licensed CC0 .
Jenny Barrow. (2019). Experimental versus nonexperimental research. https://www.youtube.com/watch?v=FJo8xyXHAlE
Leibold, N. (2020). Research variables. Measures and Concepts Commonly Encountered in EBP. Creative Commons License: BY NC
Polit, D. & Beck, C. (2021). Lippincott CoursePoint Enhanced for Polit’s Essentials of Nursing Research (10th ed.). Wolters Kluwer Health.
Evidence-Based Practice & Research Methodologies Copyright © by Tracy Fawns is licensed under a Creative Commons Attribution-NonCommercial-ShareAlike 4.0 International License , except where otherwise noted.
Share This Book
- SPECIAL COLLECTIONS
- COVID-19 Library Updates
- Make Appointment
Research 101 (A How-to Guide): Step 1. Choose a topic
- Step 1. Choose a topic
- Step 2. Get background information
- Step 3. Create a search strategy
- Step 4. Find books and e-books
- Step 5. Find articles
- Step 6. Evaluate your sources
- Step 7. Cite your sources
Step 1. Choose a Topic
Choosing an interesting research topic can be challenging. This video tutorial will help you select and properly scope your topic by employing questioning, free writing, and mind mapping techniques so that you can formulate a research question.
Good Sources for Finding a Topic
- CQ Researcher This link opens in a new window Browse the "hot topics" on the right hand side for inspiration.
- 401 Prompts for Argumentative Writing, New York Times Great questions to consider for argumentative essays.
- ProCon.org Facts, news, and thousands of diverse opinions on controversial issues in a pro-con format.
- Room For Debate, New York Times This website, created by editorial staff from the New York Times, explores close to 1,500 news events and other timely issues. Knowledgeable outside contributors provide subject background and readers may contribute their own views. Great help for choosing a topic!
- US News & World Report: Debate Club Pro/Con arguments on current issues.
- Writing Prompts, New York Times New York Times Opinion articles that are geared toward students and invite comment.
Tips for Choosing a Topic
- Choose a topic that interests you!
- Pick a manageable topic, not too broad, not too narrow. Reading background info can help you choose and limit the scope of your topic.
- Review lecture notes and class readings for ideas.
- Check with your instructor to make sure your topic fits with the assignment.
Picking your topic IS research!
- Developing a Research Question Worksheet
Mind Mapping Tools
Mind mapping, a visual form of brainstorming, is an effective technique for developing a topic. Here are some free tools to create mind maps.
- Bubbl.us Free account allows you to save 3 mind maps, download as image or HTML, and share with others.
- Coggle Sign in with your Google account to create maps that you can download as PDF or PNG or share with others.
- << Previous: Overview
- Next: Step 2. Get background information >>
- Last Updated: May 28, 2024 8:42 AM
- URL: https://libguides.depaul.edu/research101
Have a language expert improve your writing
Run a free plagiarism check in 10 minutes, automatically generate references for free.
- Knowledge Base
- Methodology
Research Design | Step-by-Step Guide with Examples
Published on 5 May 2022 by Shona McCombes . Revised on 20 March 2023.
A research design is a strategy for answering your research question using empirical data. Creating a research design means making decisions about:
- Your overall aims and approach
- The type of research design you’ll use
- Your sampling methods or criteria for selecting subjects
- Your data collection methods
- The procedures you’ll follow to collect data
- Your data analysis methods
A well-planned research design helps ensure that your methods match your research aims and that you use the right kind of analysis for your data.
Table of contents
Step 1: consider your aims and approach, step 2: choose a type of research design, step 3: identify your population and sampling method, step 4: choose your data collection methods, step 5: plan your data collection procedures, step 6: decide on your data analysis strategies, frequently asked questions.
- Introduction
Before you can start designing your research, you should already have a clear idea of the research question you want to investigate.
There are many different ways you could go about answering this question. Your research design choices should be driven by your aims and priorities – start by thinking carefully about what you want to achieve.
The first choice you need to make is whether you’ll take a qualitative or quantitative approach.
Qualitative research designs tend to be more flexible and inductive , allowing you to adjust your approach based on what you find throughout the research process.
Quantitative research designs tend to be more fixed and deductive , with variables and hypotheses clearly defined in advance of data collection.
It’s also possible to use a mixed methods design that integrates aspects of both approaches. By combining qualitative and quantitative insights, you can gain a more complete picture of the problem you’re studying and strengthen the credibility of your conclusions.
Practical and ethical considerations when designing research
As well as scientific considerations, you need to think practically when designing your research. If your research involves people or animals, you also need to consider research ethics .
- How much time do you have to collect data and write up the research?
- Will you be able to gain access to the data you need (e.g., by travelling to a specific location or contacting specific people)?
- Do you have the necessary research skills (e.g., statistical analysis or interview techniques)?
- Will you need ethical approval ?
At each stage of the research design process, make sure that your choices are practically feasible.
Prevent plagiarism, run a free check.
Within both qualitative and quantitative approaches, there are several types of research design to choose from. Each type provides a framework for the overall shape of your research.
Types of quantitative research designs
Quantitative designs can be split into four main types. Experimental and quasi-experimental designs allow you to test cause-and-effect relationships, while descriptive and correlational designs allow you to measure variables and describe relationships between them.
With descriptive and correlational designs, you can get a clear picture of characteristics, trends, and relationships as they exist in the real world. However, you can’t draw conclusions about cause and effect (because correlation doesn’t imply causation ).
Experiments are the strongest way to test cause-and-effect relationships without the risk of other variables influencing the results. However, their controlled conditions may not always reflect how things work in the real world. They’re often also more difficult and expensive to implement.
Types of qualitative research designs
Qualitative designs are less strictly defined. This approach is about gaining a rich, detailed understanding of a specific context or phenomenon, and you can often be more creative and flexible in designing your research.
The table below shows some common types of qualitative design. They often have similar approaches in terms of data collection, but focus on different aspects when analysing the data.
Your research design should clearly define who or what your research will focus on, and how you’ll go about choosing your participants or subjects.
In research, a population is the entire group that you want to draw conclusions about, while a sample is the smaller group of individuals you’ll actually collect data from.
Defining the population
A population can be made up of anything you want to study – plants, animals, organisations, texts, countries, etc. In the social sciences, it most often refers to a group of people.
For example, will you focus on people from a specific demographic, region, or background? Are you interested in people with a certain job or medical condition, or users of a particular product?
The more precisely you define your population, the easier it will be to gather a representative sample.
Sampling methods
Even with a narrowly defined population, it’s rarely possible to collect data from every individual. Instead, you’ll collect data from a sample.
To select a sample, there are two main approaches: probability sampling and non-probability sampling . The sampling method you use affects how confidently you can generalise your results to the population as a whole.
Probability sampling is the most statistically valid option, but it’s often difficult to achieve unless you’re dealing with a very small and accessible population.
For practical reasons, many studies use non-probability sampling, but it’s important to be aware of the limitations and carefully consider potential biases. You should always make an effort to gather a sample that’s as representative as possible of the population.
Case selection in qualitative research
In some types of qualitative designs, sampling may not be relevant.
For example, in an ethnography or a case study, your aim is to deeply understand a specific context, not to generalise to a population. Instead of sampling, you may simply aim to collect as much data as possible about the context you are studying.
In these types of design, you still have to carefully consider your choice of case or community. You should have a clear rationale for why this particular case is suitable for answering your research question.
For example, you might choose a case study that reveals an unusual or neglected aspect of your research problem, or you might choose several very similar or very different cases in order to compare them.
Data collection methods are ways of directly measuring variables and gathering information. They allow you to gain first-hand knowledge and original insights into your research problem.
You can choose just one data collection method, or use several methods in the same study.
Survey methods
Surveys allow you to collect data about opinions, behaviours, experiences, and characteristics by asking people directly. There are two main survey methods to choose from: questionnaires and interviews.
Observation methods
Observations allow you to collect data unobtrusively, observing characteristics, behaviours, or social interactions without relying on self-reporting.
Observations may be conducted in real time, taking notes as you observe, or you might make audiovisual recordings for later analysis. They can be qualitative or quantitative.
Other methods of data collection
There are many other ways you might collect data depending on your field and topic.
If you’re not sure which methods will work best for your research design, try reading some papers in your field to see what data collection methods they used.
Secondary data
If you don’t have the time or resources to collect data from the population you’re interested in, you can also choose to use secondary data that other researchers already collected – for example, datasets from government surveys or previous studies on your topic.
With this raw data, you can do your own analysis to answer new research questions that weren’t addressed by the original study.
Using secondary data can expand the scope of your research, as you may be able to access much larger and more varied samples than you could collect yourself.
However, it also means you don’t have any control over which variables to measure or how to measure them, so the conclusions you can draw may be limited.
As well as deciding on your methods, you need to plan exactly how you’ll use these methods to collect data that’s consistent, accurate, and unbiased.
Planning systematic procedures is especially important in quantitative research, where you need to precisely define your variables and ensure your measurements are reliable and valid.
Operationalisation
Some variables, like height or age, are easily measured. But often you’ll be dealing with more abstract concepts, like satisfaction, anxiety, or competence. Operationalisation means turning these fuzzy ideas into measurable indicators.
If you’re using observations , which events or actions will you count?
If you’re using surveys , which questions will you ask and what range of responses will be offered?
You may also choose to use or adapt existing materials designed to measure the concept you’re interested in – for example, questionnaires or inventories whose reliability and validity has already been established.
Reliability and validity
Reliability means your results can be consistently reproduced , while validity means that you’re actually measuring the concept you’re interested in.
For valid and reliable results, your measurement materials should be thoroughly researched and carefully designed. Plan your procedures to make sure you carry out the same steps in the same way for each participant.
If you’re developing a new questionnaire or other instrument to measure a specific concept, running a pilot study allows you to check its validity and reliability in advance.
Sampling procedures
As well as choosing an appropriate sampling method, you need a concrete plan for how you’ll actually contact and recruit your selected sample.
That means making decisions about things like:
- How many participants do you need for an adequate sample size?
- What inclusion and exclusion criteria will you use to identify eligible participants?
- How will you contact your sample – by mail, online, by phone, or in person?
If you’re using a probability sampling method, it’s important that everyone who is randomly selected actually participates in the study. How will you ensure a high response rate?
If you’re using a non-probability method, how will you avoid bias and ensure a representative sample?
Data management
It’s also important to create a data management plan for organising and storing your data.
Will you need to transcribe interviews or perform data entry for observations? You should anonymise and safeguard any sensitive data, and make sure it’s backed up regularly.
Keeping your data well organised will save time when it comes to analysing them. It can also help other researchers validate and add to your findings.
On their own, raw data can’t answer your research question. The last step of designing your research is planning how you’ll analyse the data.
Quantitative data analysis
In quantitative research, you’ll most likely use some form of statistical analysis . With statistics, you can summarise your sample data, make estimates, and test hypotheses.
Using descriptive statistics , you can summarise your sample data in terms of:
- The distribution of the data (e.g., the frequency of each score on a test)
- The central tendency of the data (e.g., the mean to describe the average score)
- The variability of the data (e.g., the standard deviation to describe how spread out the scores are)
The specific calculations you can do depend on the level of measurement of your variables.
Using inferential statistics , you can:
- Make estimates about the population based on your sample data.
- Test hypotheses about a relationship between variables.
Regression and correlation tests look for associations between two or more variables, while comparison tests (such as t tests and ANOVAs ) look for differences in the outcomes of different groups.
Your choice of statistical test depends on various aspects of your research design, including the types of variables you’re dealing with and the distribution of your data.
Qualitative data analysis
In qualitative research, your data will usually be very dense with information and ideas. Instead of summing it up in numbers, you’ll need to comb through the data in detail, interpret its meanings, identify patterns, and extract the parts that are most relevant to your research question.
Two of the most common approaches to doing this are thematic analysis and discourse analysis .
There are many other ways of analysing qualitative data depending on the aims of your research. To get a sense of potential approaches, try reading some qualitative research papers in your field.
A sample is a subset of individuals from a larger population. Sampling means selecting the group that you will actually collect data from in your research.
For example, if you are researching the opinions of students in your university, you could survey a sample of 100 students.
Statistical sampling allows you to test a hypothesis about the characteristics of a population. There are various sampling methods you can use to ensure that your sample is representative of the population as a whole.
Operationalisation means turning abstract conceptual ideas into measurable observations.
For example, the concept of social anxiety isn’t directly observable, but it can be operationally defined in terms of self-rating scores, behavioural avoidance of crowded places, or physical anxiety symptoms in social situations.
Before collecting data , it’s important to consider how you will operationalise the variables that you want to measure.
The research methods you use depend on the type of data you need to answer your research question .
- If you want to measure something or test a hypothesis , use quantitative methods . If you want to explore ideas, thoughts, and meanings, use qualitative methods .
- If you want to analyse a large amount of readily available data, use secondary data. If you want data specific to your purposes with control over how they are generated, collect primary data.
- If you want to establish cause-and-effect relationships between variables , use experimental methods. If you want to understand the characteristics of a research subject, use descriptive methods.
Cite this Scribbr article
If you want to cite this source, you can copy and paste the citation or click the ‘Cite this Scribbr article’ button to automatically add the citation to our free Reference Generator.
McCombes, S. (2023, March 20). Research Design | Step-by-Step Guide with Examples. Scribbr. Retrieved 31 May 2024, from https://www.scribbr.co.uk/research-methods/research-design/
Is this article helpful?

Shona McCombes
- Skip to main content
- Skip to primary sidebar
- Skip to footer
- QuestionPro

- Solutions Industries Gaming Automotive Sports and events Education Government Travel & Hospitality Financial Services Healthcare Cannabis Technology Use Case NPS+ Communities Audience Contactless surveys Mobile LivePolls Member Experience GDPR Positive People Science 360 Feedback Surveys
- Resources Blog eBooks Survey Templates Case Studies Training Help center
Home Market Research
Quantitative Research: What It Is, Practices & Methods

Quantitative research involves analyzing and gathering numerical data to uncover trends, calculate averages, evaluate relationships, and derive overarching insights. It’s used in various fields, including the natural and social sciences. Quantitative data analysis employs statistical techniques for processing and interpreting numeric data.
Research designs in the quantitative realm outline how data will be collected and analyzed with methods like experiments and surveys. Qualitative methods complement quantitative research by focusing on non-numerical data, adding depth to understanding. Data collection methods can be qualitative or quantitative, depending on research goals. Researchers often use a combination of both approaches to gain a comprehensive understanding of phenomena.
What is Quantitative Research?
Quantitative research is a systematic investigation of phenomena by gathering quantifiable data and performing statistical, mathematical, or computational techniques. Quantitative research collects statistically significant information from existing and potential customers using sampling methods and sending out online surveys , online polls , and questionnaires , for example.
One of the main characteristics of this type of research is that the results can be depicted in numerical form. After carefully collecting structured observations and understanding these numbers, it’s possible to predict the future of a product or service, establish causal relationships or Causal Research , and make changes accordingly. Quantitative research primarily centers on the analysis of numerical data and utilizes inferential statistics to derive conclusions that can be extrapolated to the broader population.
An example of a quantitative research study is the survey conducted to understand how long a doctor takes to tend to a patient when the patient walks into the hospital. A patient satisfaction survey can be administered to ask questions like how long a doctor takes to see a patient, how often a patient walks into a hospital, and other such questions, which are dependent variables in the research. This kind of research method is often employed in the social sciences, and it involves using mathematical frameworks and theories to effectively present data, ensuring that the results are logical, statistically sound, and unbiased.
Data collection in quantitative research uses a structured method and is typically conducted on larger samples representing the entire population. Researchers use quantitative methods to collect numerical data, which is then subjected to statistical analysis to determine statistically significant findings. This approach is valuable in both experimental research and social research, as it helps in making informed decisions and drawing reliable conclusions based on quantitative data.
Quantitative Research Characteristics
Quantitative research has several unique characteristics that make it well-suited for specific projects. Let’s explore the most crucial of these characteristics so that you can consider them when planning your next research project:

- Structured tools: Quantitative research relies on structured tools such as surveys, polls, or questionnaires to gather quantitative data . Using such structured methods helps collect in-depth and actionable numerical data from the survey respondents, making it easier to perform data analysis.
- Sample size: Quantitative research is conducted on a significant sample size representing the target market . Appropriate Survey Sampling methods, a fundamental aspect of quantitative research methods, must be employed when deriving the sample to fortify the research objective and ensure the reliability of the results.
- Close-ended questions: Closed-ended questions , specifically designed to align with the research objectives, are a cornerstone of quantitative research. These questions facilitate the collection of quantitative data and are extensively used in data collection processes.
- Prior studies: Before collecting feedback from respondents, researchers often delve into previous studies related to the research topic. This preliminary research helps frame the study effectively and ensures the data collection process is well-informed.
- Quantitative data: Typically, quantitative data is represented using tables, charts, graphs, or other numerical forms. This visual representation aids in understanding the collected data and is essential for rigorous data analysis, a key component of quantitative research methods.
- Generalization of results: One of the strengths of quantitative research is its ability to generalize results to the entire population. It means that the findings derived from a sample can be extrapolated to make informed decisions and take appropriate actions for improvement based on numerical data analysis.
Quantitative Research Methods
Quantitative research methods are systematic approaches used to gather and analyze numerical data to understand and draw conclusions about a phenomenon or population. Here are the quantitative research methods:
- Primary quantitative research methods
- Secondary quantitative research methods
Primary Quantitative Research Methods
Primary quantitative research is the most widely used method of conducting market research. The distinct feature of primary research is that the researcher focuses on collecting data directly rather than depending on data collected from previously done research. Primary quantitative research design can be broken down into three further distinctive tracks and the process flow. They are:
A. Techniques and Types of Studies
There are multiple types of primary quantitative research. They can be distinguished into the four following distinctive methods, which are:
01. Survey Research
Survey Research is fundamental for all quantitative outcome research methodologies and studies. Surveys are used to ask questions to a sample of respondents, using various types such as online polls, online surveys, paper questionnaires, web-intercept surveys , etc. Every small and big organization intends to understand what their customers think about their products and services, how well new features are faring in the market, and other such details.
By conducting survey research, an organization can ask multiple survey questions , collect data from a pool of customers, and analyze this collected data to produce numerical results. It is the first step towards collecting data for any research. You can use single ease questions . A single-ease question is a straightforward query that elicits a concise and uncomplicated response.
This type of research can be conducted with a specific target audience group and also can be conducted across multiple groups along with comparative analysis . A prerequisite for this type of research is that the sample of respondents must have randomly selected members. This way, a researcher can easily maintain the accuracy of the obtained results as a huge variety of respondents will be addressed using random selection.
Traditionally, survey research was conducted face-to-face or via phone calls. Still, with the progress made by online mediums such as email or social media, survey research has also spread to online mediums.There are two types of surveys , either of which can be chosen based on the time in hand and the kind of data required:
Cross-sectional surveys: Cross-sectional surveys are observational surveys conducted in situations where the researcher intends to collect data from a sample of the target population at a given point in time. Researchers can evaluate various variables at a particular time. Data gathered using this type of survey is from people who depict similarity in all variables except the variables which are considered for research . Throughout the survey, this one variable will stay constant.
- Cross-sectional surveys are popular with retail, SMEs, and healthcare industries. Information is garnered without modifying any parameters in the variable ecosystem.
- Multiple samples can be analyzed and compared using a cross-sectional survey research method.
- Multiple variables can be evaluated using this type of survey research.
- The only disadvantage of cross-sectional surveys is that the cause-effect relationship of variables cannot be established as it usually evaluates variables at a particular time and not across a continuous time frame.
Longitudinal surveys: Longitudinal surveys are also observational surveys , but unlike cross-sectional surveys, longitudinal surveys are conducted across various time durations to observe a change in respondent behavior and thought processes. This time can be days, months, years, or even decades. For instance, a researcher planning to analyze the change in buying habits of teenagers over 5 years will conduct longitudinal surveys.
- In cross-sectional surveys, the same variables were evaluated at a given time, and in longitudinal surveys, different variables can be analyzed at different intervals.
- Longitudinal surveys are extensively used in the field of medicine and applied sciences. Apart from these two fields, they are also used to observe a change in the market trend analysis , analyze customer satisfaction, or gain feedback on products/services.
- In situations where the sequence of events is highly essential, longitudinal surveys are used.
- Researchers say that when research subjects need to be thoroughly inspected before concluding, they rely on longitudinal surveys.
02. Correlational Research
A comparison between two entities is invariable. Correlation research is conducted to establish a relationship between two closely-knit entities and how one impacts the other, and what changes are eventually observed. This research method is carried out to give value to naturally occurring relationships, and a minimum of two different groups are required to conduct this quantitative research method successfully. Without assuming various aspects, a relationship between two groups or entities must be established.
Researchers use this quantitative research design to correlate two or more variables using mathematical analysis methods. Patterns, relationships, and trends between variables are concluded as they exist in their original setup. The impact of one of these variables on the other is observed, along with how it changes the relationship between the two variables. Researchers tend to manipulate one of the variables to attain the desired results.
Ideally, it is advised not to make conclusions merely based on correlational research. This is because it is not mandatory that if two variables are in sync that they are interrelated.
Example of Correlational Research Questions :
- The relationship between stress and depression.
- The equation between fame and money.
- The relation between activities in a third-grade class and its students.
03. Causal-comparative Research
This research method mainly depends on the factor of comparison. Also called quasi-experimental research , this quantitative research method is used by researchers to conclude the cause-effect equation between two or more variables, where one variable is dependent on the other independent variable. The independent variable is established but not manipulated, and its impact on the dependent variable is observed. These variables or groups must be formed as they exist in the natural setup. As the dependent and independent variables will always exist in a group, it is advised that the conclusions are carefully established by keeping all the factors in mind.
Causal-comparative research is not restricted to the statistical analysis of two variables but extends to analyzing how various variables or groups change under the influence of the same changes. This research is conducted irrespective of the type of relationship that exists between two or more variables. Statistical analysis plan is used to present the outcome using this quantitative research method.
Example of Causal-Comparative Research Questions:
- The impact of drugs on a teenager. The effect of good education on a freshman. The effect of substantial food provision in the villages of Africa.
04. Experimental Research
Also known as true experimentation, this research method relies on a theory. As the name suggests, experimental research is usually based on one or more theories. This theory has yet to be proven before and is merely a supposition. In experimental research, an analysis is done around proving or disproving the statement. This research method is used in natural sciences. Traditional research methods are more effective than modern techniques.
There can be multiple theories in experimental research. A theory is a statement that can be verified or refuted.
After establishing the statement, efforts are made to understand whether it is valid or invalid. This quantitative research method is mainly used in natural or social sciences as various statements must be proved right or wrong.
- Traditional research methods are more effective than modern techniques.
- Systematic teaching schedules help children who struggle to cope with the course.
- It is a boon to have responsible nursing staff for ailing parents.
B. Data Collection Methodologies
The second major step in primary quantitative research is data collection. Data collection can be divided into sampling methods and data collection using surveys and polls.
01. Data Collection Methodologies: Sampling Methods
There are two main sampling methods for quantitative research: Probability and Non-probability sampling .
Probability sampling: A theory of probability is used to filter individuals from a population and create samples in probability sampling . Participants of a sample are chosen by random selection processes. Each target audience member has an equal opportunity to be selected in the sample.
There are four main types of probability sampling:
- Simple random sampling: As the name indicates, simple random sampling is nothing but a random selection of elements for a sample. This sampling technique is implemented where the target population is considerably large.
- Stratified random sampling: In the stratified random sampling method , a large population is divided into groups (strata), and members of a sample are chosen randomly from these strata. The various segregated strata should ideally not overlap one another.
- Cluster sampling: Cluster sampling is a probability sampling method using which the main segment is divided into clusters, usually using geographic segmentation and demographic segmentation parameters.
- Systematic sampling: Systematic sampling is a technique where the starting point of the sample is chosen randomly, and all the other elements are chosen using a fixed interval. This interval is calculated by dividing the population size by the target sample size.
Non-probability sampling: Non-probability sampling is where the researcher’s knowledge and experience are used to create samples. Because of the researcher’s involvement, not all the target population members have an equal probability of being selected to be a part of a sample.
There are five non-probability sampling models:
- Convenience sampling: In convenience sampling , elements of a sample are chosen only due to one prime reason: their proximity to the researcher. These samples are quick and easy to implement as there is no other parameter of selection involved.
- Consecutive sampling: Consecutive sampling is quite similar to convenience sampling, except for the fact that researchers can choose a single element or a group of samples and conduct research consecutively over a significant period and then perform the same process with other samples.
- Quota sampling: Using quota sampling , researchers can select elements using their knowledge of target traits and personalities to form strata. Members of various strata can then be chosen to be a part of the sample as per the researcher’s understanding.
- Snowball sampling: Snowball sampling is conducted with target audiences who are difficult to contact and get information. It is popular in cases where the target audience for analysis research is rare to put together.
- Judgmental sampling: Judgmental sampling is a non-probability sampling method where samples are created only based on the researcher’s experience and research skill .
02. Data collection methodologies: Using surveys & polls
Once the sample is determined, then either surveys or polls can be distributed to collect the data for quantitative research.
Using surveys for primary quantitative research
A survey is defined as a research method used for collecting data from a pre-defined group of respondents to gain information and insights on various topics of interest. The ease of survey distribution and the wide number of people it can reach depending on the research time and objective makes it one of the most important aspects of conducting quantitative research.
Fundamental levels of measurement – nominal, ordinal, interval, and ratio scales
Four measurement scales are fundamental to creating a multiple-choice question in a survey. They are nominal, ordinal, interval, and ratio measurement scales without the fundamentals of which no multiple-choice questions can be created. Hence, it is crucial to understand these measurement levels to develop a robust survey.
Use of different question types
To conduct quantitative research, close-ended questions must be used in a survey. They can be a mix of multiple question types, including multiple-choice questions like semantic differential scale questions , rating scale questions , etc.
Survey Distribution and Survey Data Collection
In the above, we have seen the process of building a survey along with the research design to conduct primary quantitative research. Survey distribution to collect data is the other important aspect of the survey process. There are different ways of survey distribution. Some of the most commonly used methods are:
- Email: Sending a survey via email is the most widely used and effective survey distribution method. This method’s response rate is high because the respondents know your brand. You can use the QuestionPro email management feature to send out and collect survey responses.
- Buy respondents: Another effective way to distribute a survey and conduct primary quantitative research is to use a sample. Since the respondents are knowledgeable and are on the panel by their own will, responses are much higher.
- Embed survey on a website: Embedding a survey on a website increases a high number of responses as the respondent is already in close proximity to the brand when the survey pops up.
- Social distribution: Using social media to distribute the survey aids in collecting a higher number of responses from the people that are aware of the brand.
- QR code: QuestionPro QR codes store the URL for the survey. You can print/publish this code in magazines, signs, business cards, or on just about any object/medium.
- SMS survey: The SMS survey is a quick and time-effective way to collect a high number of responses.
- Offline Survey App: The QuestionPro App allows users to circulate surveys quickly, and the responses can be collected both online and offline.
Survey example
An example of a survey is a short customer satisfaction (CSAT) survey that can quickly be built and deployed to collect feedback about what the customer thinks about a brand and how satisfied and referenceable the brand is.
Using polls for primary quantitative research
Polls are a method to collect feedback using close-ended questions from a sample. The most commonly used types of polls are election polls and exit polls . Both of these are used to collect data from a large sample size but using basic question types like multiple-choice questions.
C. Data Analysis Techniques
The third aspect of primary quantitative research design is data analysis . After collecting raw data, there must be an analysis of this data to derive statistical inferences from this research. It is important to relate the results to the research objective and establish the statistical relevance of the results.
Remember to consider aspects of research that were not considered for the data collection process and report the difference between what was planned vs. what was actually executed.
It is then required to select precise Statistical Analysis Methods , such as SWOT, Conjoint, Cross-tabulation, etc., to analyze the quantitative data.
- SWOT analysis: SWOT Analysis stands for the acronym of Strengths, Weaknesses, Opportunities, and Threat analysis. Organizations use this statistical analysis technique to evaluate their performance internally and externally to develop effective strategies for improvement.
- Conjoint Analysis: Conjoint Analysis is a market analysis method to learn how individuals make complicated purchasing decisions. Trade-offs are involved in an individual’s daily activities, and these reflect their ability to decide from a complex list of product/service options.
- Cross-tabulation: Cross-tabulation is one of the preliminary statistical market analysis methods which establishes relationships, patterns, and trends within the various parameters of the research study.
- TURF Analysis: TURF Analysis , an acronym for Totally Unduplicated Reach and Frequency Analysis, is executed in situations where the reach of a favorable communication source is to be analyzed along with the frequency of this communication. It is used for understanding the potential of a target market.
Inferential statistics methods such as confidence interval, the margin of error, etc., can then be used to provide results.
Secondary Quantitative Research Methods
Secondary quantitative research or desk research is a research method that involves using already existing data or secondary data. Existing data is summarized and collated to increase the overall effectiveness of the research.
This research method involves collecting quantitative data from existing data sources like the internet, government resources, libraries, research reports, etc. Secondary quantitative research helps to validate the data collected from primary quantitative research and aid in strengthening or proving, or disproving previously collected data.
The following are five popularly used secondary quantitative research methods:
- Data available on the internet: With the high penetration of the internet and mobile devices, it has become increasingly easy to conduct quantitative research using the internet. Information about most research topics is available online, and this aids in boosting the validity of primary quantitative data.
- Government and non-government sources: Secondary quantitative research can also be conducted with the help of government and non-government sources that deal with market research reports. This data is highly reliable and in-depth and hence, can be used to increase the validity of quantitative research design.
- Public libraries: Now a sparingly used method of conducting quantitative research, it is still a reliable source of information, though. Public libraries have copies of important research that was conducted earlier. They are a storehouse of valuable information and documents from which information can be extracted.
- Educational institutions: Educational institutions conduct in-depth research on multiple topics, and hence, the reports that they publish are an important source of validation in quantitative research.
- Commercial information sources: Local newspapers, journals, magazines, radio, and TV stations are great sources to obtain data for secondary quantitative research. These commercial information sources have in-depth, first-hand information on market research, demographic segmentation, and similar subjects.
Quantitative Research Examples
Some examples of quantitative research are:
- A customer satisfaction template can be used if any organization would like to conduct a customer satisfaction (CSAT) survey . Through this kind of survey, an organization can collect quantitative data and metrics on the goodwill of the brand or organization in the customer’s mind based on multiple parameters such as product quality, pricing, customer experience, etc. This data can be collected by asking a net promoter score (NPS) question , matrix table questions, etc. that provide data in the form of numbers that can be analyzed and worked upon.
- Another example of quantitative research is an organization that conducts an event, collecting feedback from attendees about the value they see from the event. By using an event survey , the organization can collect actionable feedback about the satisfaction levels of customers during various phases of the event such as the sales, pre and post-event, the likelihood of recommending the organization to their friends and colleagues, hotel preferences for the future events and other such questions.
What are the Advantages of Quantitative Research?
There are many advantages to quantitative research. Some of the major advantages of why researchers use this method in market research are:

Collect Reliable and Accurate Data:
Quantitative research is a powerful method for collecting reliable and accurate quantitative data. Since data is collected, analyzed, and presented in numbers, the results obtained are incredibly reliable and objective. Numbers do not lie and offer an honest and precise picture of the conducted research without discrepancies. In situations where a researcher aims to eliminate bias and predict potential conflicts, quantitative research is the method of choice.
Quick Data Collection:
Quantitative research involves studying a group of people representing a larger population. Researchers use a survey or another quantitative research method to efficiently gather information from these participants, making the process of analyzing the data and identifying patterns faster and more manageable through the use of statistical analysis. This advantage makes quantitative research an attractive option for projects with time constraints.
Wider Scope of Data Analysis:
Quantitative research, thanks to its utilization of statistical methods, offers an extensive range of data collection and analysis. Researchers can delve into a broader spectrum of variables and relationships within the data, enabling a more thorough comprehension of the subject under investigation. This expanded scope is precious when dealing with complex research questions that require in-depth numerical analysis.
Eliminate Bias:
One of the significant advantages of quantitative research is its ability to eliminate bias. This research method leaves no room for personal comments or the biasing of results, as the findings are presented in numerical form. This objectivity makes the results fair and reliable in most cases, reducing the potential for researcher bias or subjectivity.
In summary, quantitative research involves collecting, analyzing, and presenting quantitative data using statistical analysis. It offers numerous advantages, including the collection of reliable and accurate data, quick data collection, a broader scope of data analysis, and the elimination of bias, making it a valuable approach in the field of research. When considering the benefits of quantitative research, it’s essential to recognize its strengths in contrast to qualitative methods and its role in collecting and analyzing numerical data for a more comprehensive understanding of research topics.
Best Practices to Conduct Quantitative Research
Here are some best practices for conducting quantitative research:

- Differentiate between quantitative and qualitative: Understand the difference between the two methodologies and apply the one that suits your needs best.
- Choose a suitable sample size: Ensure that you have a sample representative of your population and large enough to be statistically weighty.
- Keep your research goals clear and concise: Know your research goals before you begin data collection to ensure you collect the right amount and the right quantity of data.
- Keep the questions simple: Remember that you will be reaching out to a demographically wide audience. Pose simple questions for your respondents to understand easily.
Quantitative Research vs Qualitative Research
Quantitative research and qualitative research are two distinct approaches to conducting research, each with its own set of methods and objectives. Here’s a comparison of the two:

Quantitative Research
- Objective: The primary goal of quantitative research is to quantify and measure phenomena by collecting numerical data. It aims to test hypotheses, establish patterns, and generalize findings to a larger population.
- Data Collection: Quantitative research employs systematic and standardized approaches for data collection, including techniques like surveys, experiments, and observations that involve predefined variables. It is often collected from a large and representative sample.
- Data Analysis: Data is analyzed using statistical techniques, such as descriptive statistics, inferential statistics, and mathematical modeling. Researchers use statistical tests to draw conclusions and make generalizations based on numerical data.
- Sample Size: Quantitative research often involves larger sample sizes to ensure statistical significance and generalizability.
- Results: The results are typically presented in tables, charts, and statistical summaries, making them highly structured and objective.
- Generalizability: Researchers intentionally structure quantitative research to generate outcomes that can be helpful to a larger population, and they frequently seek to establish causative connections.
- Emphasis on Objectivity: Researchers aim to minimize bias and subjectivity, focusing on replicable and objective findings.
Qualitative Research
- Objective: Qualitative research seeks to gain a deeper understanding of the underlying motivations, behaviors, and experiences of individuals or groups. It explores the context and meaning of phenomena.
- Data Collection: Qualitative research employs adaptable and open-ended techniques for data collection, including methods like interviews, focus groups, observations, and content analysis. It allows participants to express their perspectives in their own words.
- Data Analysis: Data is analyzed through thematic analysis, content analysis, or grounded theory. Researchers focus on identifying patterns, themes, and insights in the data.
- Sample Size: Qualitative research typically involves smaller sample sizes due to the in-depth nature of data collection and analysis.
- Results: Findings are presented in narrative form, often in the participants’ own words. Results are subjective, context-dependent, and provide rich, detailed descriptions.
- Generalizability: Qualitative research does not aim for broad generalizability but focuses on in-depth exploration within a specific context. It provides a detailed understanding of a particular group or situation.
- Emphasis on Subjectivity: Researchers acknowledge the role of subjectivity and the researcher’s influence on the Research Process . Participant perspectives and experiences are central to the findings.
Researchers choose between quantitative and qualitative research methods based on their research objectives and the nature of the research question. Each approach has its advantages and drawbacks, and the decision between them hinges on the particular research objectives and the data needed to address research inquiries effectively.
Quantitative research is a structured way of collecting and analyzing data from various sources. Its purpose is to quantify the problem and understand its extent, seeking results that someone can project to a larger population.
Companies that use quantitative rather than qualitative research typically aim to measure magnitudes and seek objectively interpreted statistical results. So if you want to obtain quantitative data that helps you define the structured cause-and-effect relationship between the research problem and the factors, you should opt for this type of research.
At QuestionPro , we have various Best Data Collection Tools and features to conduct investigations of this type. You can create questionnaires and distribute them through our various methods. We also have sample services or various questions to guarantee the success of your study and the quality of the collected data.
Quantitative research is a systematic and structured approach to studying phenomena that involves the collection of measurable data and the application of statistical, mathematical, or computational techniques for analysis.
Quantitative research is characterized by structured tools like surveys, substantial sample sizes, closed-ended questions, reliance on prior studies, data presented numerically, and the ability to generalize findings to the broader population.
The two main methods of quantitative research are Primary quantitative research methods, involving data collection directly from sources, and Secondary quantitative research methods, which utilize existing data for analysis.
1.Surveying to measure employee engagement with numerical rating scales. 2.Analyzing sales data to identify trends in product demand and market share. 4.Examining test scores to assess the impact of a new teaching method on student performance. 4.Using website analytics to track user behavior and conversion rates for an online store.
1.Differentiate between quantitative and qualitative approaches. 2.Choose a representative sample size. 3.Define clear research goals before data collection. 4.Use simple and easily understandable survey questions.
MORE LIKE THIS

Raked Weighting: A Key Tool for Accurate Survey Results
May 31, 2024

Top 8 Data Trends to Understand the Future of Data
May 30, 2024

Top 12 Interactive Presentation Software to Engage Your User
May 29, 2024

Trend Report: Guide for Market Dynamics & Strategic Analysis
Other categories.
- Academic Research
- Artificial Intelligence
- Assessments
- Brand Awareness
- Case Studies
- Communities
- Consumer Insights
- Customer effort score
- Customer Engagement
- Customer Experience
- Customer Loyalty
- Customer Research
- Customer Satisfaction
- Employee Benefits
- Employee Engagement
- Employee Retention
- Friday Five
- General Data Protection Regulation
- Insights Hub
- Life@QuestionPro
- Market Research
- Mobile diaries
- Mobile Surveys
- New Features
- Online Communities
- Question Types
- Questionnaire
- QuestionPro Products
- Release Notes
- Research Tools and Apps
- Revenue at Risk
- Survey Templates
- Training Tips
- Uncategorized
- Video Learning Series
- What’s Coming Up
- Workforce Intelligence
- Privacy Policy
Home » Quantitative Research – Methods, Types and Analysis
Quantitative Research – Methods, Types and Analysis
Table of Contents

Quantitative Research
Quantitative research is a type of research that collects and analyzes numerical data to test hypotheses and answer research questions . This research typically involves a large sample size and uses statistical analysis to make inferences about a population based on the data collected. It often involves the use of surveys, experiments, or other structured data collection methods to gather quantitative data.
Quantitative Research Methods

Quantitative Research Methods are as follows:
Descriptive Research Design
Descriptive research design is used to describe the characteristics of a population or phenomenon being studied. This research method is used to answer the questions of what, where, when, and how. Descriptive research designs use a variety of methods such as observation, case studies, and surveys to collect data. The data is then analyzed using statistical tools to identify patterns and relationships.
Correlational Research Design
Correlational research design is used to investigate the relationship between two or more variables. Researchers use correlational research to determine whether a relationship exists between variables and to what extent they are related. This research method involves collecting data from a sample and analyzing it using statistical tools such as correlation coefficients.
Quasi-experimental Research Design
Quasi-experimental research design is used to investigate cause-and-effect relationships between variables. This research method is similar to experimental research design, but it lacks full control over the independent variable. Researchers use quasi-experimental research designs when it is not feasible or ethical to manipulate the independent variable.
Experimental Research Design
Experimental research design is used to investigate cause-and-effect relationships between variables. This research method involves manipulating the independent variable and observing the effects on the dependent variable. Researchers use experimental research designs to test hypotheses and establish cause-and-effect relationships.
Survey Research
Survey research involves collecting data from a sample of individuals using a standardized questionnaire. This research method is used to gather information on attitudes, beliefs, and behaviors of individuals. Researchers use survey research to collect data quickly and efficiently from a large sample size. Survey research can be conducted through various methods such as online, phone, mail, or in-person interviews.
Quantitative Research Analysis Methods
Here are some commonly used quantitative research analysis methods:
Statistical Analysis
Statistical analysis is the most common quantitative research analysis method. It involves using statistical tools and techniques to analyze the numerical data collected during the research process. Statistical analysis can be used to identify patterns, trends, and relationships between variables, and to test hypotheses and theories.
Regression Analysis
Regression analysis is a statistical technique used to analyze the relationship between one dependent variable and one or more independent variables. Researchers use regression analysis to identify and quantify the impact of independent variables on the dependent variable.
Factor Analysis
Factor analysis is a statistical technique used to identify underlying factors that explain the correlations among a set of variables. Researchers use factor analysis to reduce a large number of variables to a smaller set of factors that capture the most important information.
Structural Equation Modeling
Structural equation modeling is a statistical technique used to test complex relationships between variables. It involves specifying a model that includes both observed and unobserved variables, and then using statistical methods to test the fit of the model to the data.
Time Series Analysis
Time series analysis is a statistical technique used to analyze data that is collected over time. It involves identifying patterns and trends in the data, as well as any seasonal or cyclical variations.
Multilevel Modeling
Multilevel modeling is a statistical technique used to analyze data that is nested within multiple levels. For example, researchers might use multilevel modeling to analyze data that is collected from individuals who are nested within groups, such as students nested within schools.
Applications of Quantitative Research
Quantitative research has many applications across a wide range of fields. Here are some common examples:
- Market Research : Quantitative research is used extensively in market research to understand consumer behavior, preferences, and trends. Researchers use surveys, experiments, and other quantitative methods to collect data that can inform marketing strategies, product development, and pricing decisions.
- Health Research: Quantitative research is used in health research to study the effectiveness of medical treatments, identify risk factors for diseases, and track health outcomes over time. Researchers use statistical methods to analyze data from clinical trials, surveys, and other sources to inform medical practice and policy.
- Social Science Research: Quantitative research is used in social science research to study human behavior, attitudes, and social structures. Researchers use surveys, experiments, and other quantitative methods to collect data that can inform social policies, educational programs, and community interventions.
- Education Research: Quantitative research is used in education research to study the effectiveness of teaching methods, assess student learning outcomes, and identify factors that influence student success. Researchers use experimental and quasi-experimental designs, as well as surveys and other quantitative methods, to collect and analyze data.
- Environmental Research: Quantitative research is used in environmental research to study the impact of human activities on the environment, assess the effectiveness of conservation strategies, and identify ways to reduce environmental risks. Researchers use statistical methods to analyze data from field studies, experiments, and other sources.
Characteristics of Quantitative Research
Here are some key characteristics of quantitative research:
- Numerical data : Quantitative research involves collecting numerical data through standardized methods such as surveys, experiments, and observational studies. This data is analyzed using statistical methods to identify patterns and relationships.
- Large sample size: Quantitative research often involves collecting data from a large sample of individuals or groups in order to increase the reliability and generalizability of the findings.
- Objective approach: Quantitative research aims to be objective and impartial in its approach, focusing on the collection and analysis of data rather than personal beliefs, opinions, or experiences.
- Control over variables: Quantitative research often involves manipulating variables to test hypotheses and establish cause-and-effect relationships. Researchers aim to control for extraneous variables that may impact the results.
- Replicable : Quantitative research aims to be replicable, meaning that other researchers should be able to conduct similar studies and obtain similar results using the same methods.
- Statistical analysis: Quantitative research involves using statistical tools and techniques to analyze the numerical data collected during the research process. Statistical analysis allows researchers to identify patterns, trends, and relationships between variables, and to test hypotheses and theories.
- Generalizability: Quantitative research aims to produce findings that can be generalized to larger populations beyond the specific sample studied. This is achieved through the use of random sampling methods and statistical inference.
Examples of Quantitative Research
Here are some examples of quantitative research in different fields:
- Market Research: A company conducts a survey of 1000 consumers to determine their brand awareness and preferences. The data is analyzed using statistical methods to identify trends and patterns that can inform marketing strategies.
- Health Research : A researcher conducts a randomized controlled trial to test the effectiveness of a new drug for treating a particular medical condition. The study involves collecting data from a large sample of patients and analyzing the results using statistical methods.
- Social Science Research : A sociologist conducts a survey of 500 people to study attitudes toward immigration in a particular country. The data is analyzed using statistical methods to identify factors that influence these attitudes.
- Education Research: A researcher conducts an experiment to compare the effectiveness of two different teaching methods for improving student learning outcomes. The study involves randomly assigning students to different groups and collecting data on their performance on standardized tests.
- Environmental Research : A team of researchers conduct a study to investigate the impact of climate change on the distribution and abundance of a particular species of plant or animal. The study involves collecting data on environmental factors and population sizes over time and analyzing the results using statistical methods.
- Psychology : A researcher conducts a survey of 500 college students to investigate the relationship between social media use and mental health. The data is analyzed using statistical methods to identify correlations and potential causal relationships.
- Political Science: A team of researchers conducts a study to investigate voter behavior during an election. They use survey methods to collect data on voting patterns, demographics, and political attitudes, and analyze the results using statistical methods.
How to Conduct Quantitative Research
Here is a general overview of how to conduct quantitative research:
- Develop a research question: The first step in conducting quantitative research is to develop a clear and specific research question. This question should be based on a gap in existing knowledge, and should be answerable using quantitative methods.
- Develop a research design: Once you have a research question, you will need to develop a research design. This involves deciding on the appropriate methods to collect data, such as surveys, experiments, or observational studies. You will also need to determine the appropriate sample size, data collection instruments, and data analysis techniques.
- Collect data: The next step is to collect data. This may involve administering surveys or questionnaires, conducting experiments, or gathering data from existing sources. It is important to use standardized methods to ensure that the data is reliable and valid.
- Analyze data : Once the data has been collected, it is time to analyze it. This involves using statistical methods to identify patterns, trends, and relationships between variables. Common statistical techniques include correlation analysis, regression analysis, and hypothesis testing.
- Interpret results: After analyzing the data, you will need to interpret the results. This involves identifying the key findings, determining their significance, and drawing conclusions based on the data.
- Communicate findings: Finally, you will need to communicate your findings. This may involve writing a research report, presenting at a conference, or publishing in a peer-reviewed journal. It is important to clearly communicate the research question, methods, results, and conclusions to ensure that others can understand and replicate your research.
When to use Quantitative Research
Here are some situations when quantitative research can be appropriate:
- To test a hypothesis: Quantitative research is often used to test a hypothesis or a theory. It involves collecting numerical data and using statistical analysis to determine if the data supports or refutes the hypothesis.
- To generalize findings: If you want to generalize the findings of your study to a larger population, quantitative research can be useful. This is because it allows you to collect numerical data from a representative sample of the population and use statistical analysis to make inferences about the population as a whole.
- To measure relationships between variables: If you want to measure the relationship between two or more variables, such as the relationship between age and income, or between education level and job satisfaction, quantitative research can be useful. It allows you to collect numerical data on both variables and use statistical analysis to determine the strength and direction of the relationship.
- To identify patterns or trends: Quantitative research can be useful for identifying patterns or trends in data. For example, you can use quantitative research to identify trends in consumer behavior or to identify patterns in stock market data.
- To quantify attitudes or opinions : If you want to measure attitudes or opinions on a particular topic, quantitative research can be useful. It allows you to collect numerical data using surveys or questionnaires and analyze the data using statistical methods to determine the prevalence of certain attitudes or opinions.
Purpose of Quantitative Research
The purpose of quantitative research is to systematically investigate and measure the relationships between variables or phenomena using numerical data and statistical analysis. The main objectives of quantitative research include:
- Description : To provide a detailed and accurate description of a particular phenomenon or population.
- Explanation : To explain the reasons for the occurrence of a particular phenomenon, such as identifying the factors that influence a behavior or attitude.
- Prediction : To predict future trends or behaviors based on past patterns and relationships between variables.
- Control : To identify the best strategies for controlling or influencing a particular outcome or behavior.
Quantitative research is used in many different fields, including social sciences, business, engineering, and health sciences. It can be used to investigate a wide range of phenomena, from human behavior and attitudes to physical and biological processes. The purpose of quantitative research is to provide reliable and valid data that can be used to inform decision-making and improve understanding of the world around us.
Advantages of Quantitative Research
There are several advantages of quantitative research, including:
- Objectivity : Quantitative research is based on objective data and statistical analysis, which reduces the potential for bias or subjectivity in the research process.
- Reproducibility : Because quantitative research involves standardized methods and measurements, it is more likely to be reproducible and reliable.
- Generalizability : Quantitative research allows for generalizations to be made about a population based on a representative sample, which can inform decision-making and policy development.
- Precision : Quantitative research allows for precise measurement and analysis of data, which can provide a more accurate understanding of phenomena and relationships between variables.
- Efficiency : Quantitative research can be conducted relatively quickly and efficiently, especially when compared to qualitative research, which may involve lengthy data collection and analysis.
- Large sample sizes : Quantitative research can accommodate large sample sizes, which can increase the representativeness and generalizability of the results.
Limitations of Quantitative Research
There are several limitations of quantitative research, including:
- Limited understanding of context: Quantitative research typically focuses on numerical data and statistical analysis, which may not provide a comprehensive understanding of the context or underlying factors that influence a phenomenon.
- Simplification of complex phenomena: Quantitative research often involves simplifying complex phenomena into measurable variables, which may not capture the full complexity of the phenomenon being studied.
- Potential for researcher bias: Although quantitative research aims to be objective, there is still the potential for researcher bias in areas such as sampling, data collection, and data analysis.
- Limited ability to explore new ideas: Quantitative research is often based on pre-determined research questions and hypotheses, which may limit the ability to explore new ideas or unexpected findings.
- Limited ability to capture subjective experiences : Quantitative research is typically focused on objective data and may not capture the subjective experiences of individuals or groups being studied.
- Ethical concerns : Quantitative research may raise ethical concerns, such as invasion of privacy or the potential for harm to participants.
About the author

Muhammad Hassan
Researcher, Academic Writer, Web developer
You may also like

Questionnaire – Definition, Types, and Examples

Case Study – Methods, Examples and Guide

Observational Research – Methods and Guide

Qualitative Research Methods

Explanatory Research – Types, Methods, Guide

Survey Research – Types, Methods, Examples

- Customer Reviews
- Extended Essays
- IB Internal Assessment
- Theory of Knowledge
- Literature Review
- Dissertations
- Essay Writing
- Research Writing
- Assignment Help
- Capstone Projects
- College Application
- Online Class
How to Select a Research Topic: A Step-by-Step Guide (2021)

by Antony W
September 15, 2021

Learning how to select a research topic can be the difference between failing your assignment and writing a comprehensive research paper. That’s why in this guide we’ll teach you how to select a research topic step-by-step.
You don’t need this guide if your professor has already given you a list of topics to consider for your assignment . You can skip to our guide on how to write a research paper .
If they have left it up to you to choose a topic to investigate, which they must approve before you start working on your research study, we suggest that you read the process shared in this post.
Choosing a topic after finding your research problem is important because:
- The topic guides your research and gives you a mean to not only arrive at other interesting topics but also direct you to discover new knowledge
- The topic you choose will govern what you say and ensures you keep a logical flow of information.
Picking a topic for a research paper can be challenging and sometimes intimidating, but it’s not impossible. In the following section, we show you how to choose the best research topic that your instructor can approve after the first review.
How to Select a Research Topic
Below are four steps to follow to find the most suitable topic for your research paper assignment:
Step 1: Consider a Topic that Interests You

If your professor has asked you to choose a topic for your research paper, it means you can choose just about any subject to focus on in your area of study. A significant first step to take is to consider topics that interest you.
An interesting topic should meet two very important conditions.
First, it should be concise. The topic you choose should not be too broad or two narrow. Rather, it should be something focused on a specific issue. Second, the topic should allow you to find enough sources to cite in the research stage of your assignment.
The best way to determine if the research topic is interesting is to do some free writing for about 10 minutes. As you free write, think about the number of questions that people ask about the topic and try to consider why they’re important. These questions are important because they will make the research stage easier for you.
You’ll probably have a long list of interesting topics to consider for your research assignment. That’s a good first step because it means your options aren’t limited. However, you need to narrow down to only one topic for the assignment, so it’s time to start brainstorming.
Step 2: Brainstorm Your Topics

You aren’t doing research at this stage yet. You are only trying to make considerations to determine which topic will suit your research assignment.
The brainstorming stage isn’t difficult at all. It should take only a couple of hours or a few days depending on how you approach.
We recommend talking to your professor, classmates, and friends about the topics that you’ve picked and ask for their opinion. Expect mixed opinions from this audience and then consider the topics that make the most sense. Note what topics picked their interest the most and put them on top of the list.
You’ll end up removing some topics from your initial list after brainstorming, and that’s completely fine. The goal here is to end up with a topic that interests you as well as your readers.
Step 3: Define Your Topics

Check once again to make sure that your topic is a subject that you can easily define. You want to make sure the topic isn’t too broad or too narrow.
Often, a broad topic presents overwhelming amount of information, which makes it difficult to write a comprehensive research paper. A narrow topic, on the other hand, means you’ll find very little information, and therefore it can be difficult to do your assignment.
The length of the research paper, as stated in the assignment brief, should guide your topic selection.
Narrow down your list to topics that are:
- Broad enough to allows you to find enough scholarly articles and journals for reference
- Narrow enough to fit within the expected word count and the scope of the research
Topics that meet these two conditions should be easy to work on as they easily fit within the constraints of the research assignment.
Step 4: Read Background Information of Selected Topics

You probably have two or three topics by the time you get to this step. Now it’s time to read the background information on the topics to decide which topic to work on.
This step is important because it gives you a clear overview of the topic, enabling you to see how it relates to broader, narrower, and related concepts. Preliminary research also helps you to find keywords commonly used to describe the topic, which may be useful in further research.
It’s important to note how easy or difficult it is to find information on the topic.
Look at different sources of information to be sure you can find enough references for the topic. Such periodic indexes scan journals, newspaper articles, and magazines to find the information you’re looking for. You can even use web search engines. Google and Bing are currently that best options to consider because they make it easy for searchers to find relevant information on scholarly topics.
If you’re having a hard time to find references for a topic that you’ve so far considered for your research paper, skip it and go to the next one. Doing so will go a long way to ensure you have the right topic to work on from start to finish.
Get Research Paper Writing Help
If you’ve found your research topic but you feel so stuck that you can’t proceed with the assignment without some assistance, we are here to help. With our research paper writing service , we can help you handle the assignment within the shortest time possible.
We will research your topic, develop a research question, outline the project, and help you with writing. We also get you involved in the process, allowing you to track the progress of your order until the delivery stage.
About the author
Antony W is a professional writer and coach at Help for Assessment. He spends countless hours every day researching and writing great content filled with expert advice on how to write engaging essays, research papers, and assignments.
IMAGES
VIDEO
COMMENTS
To choose the right research methodology for your dissertation or thesis, you need to consider three important factors. Based on these three factors, you can decide on your overarching approach - qualitative, quantitative or mixed methods. Once you've made that decision, you can flesh out the finer details of your methodology, such as the ...
INTRODUCTION. Scientific research is usually initiated by posing evidenced-based research questions which are then explicitly restated as hypotheses.1,2 The hypotheses provide directions to guide the study, solutions, explanations, and expected results.3,4 Both research questions and hypotheses are essentially formulated based on conventional theories and real-world processes, which allow the ...
Revised on June 22, 2023. Quantitative research is the process of collecting and analyzing numerical data. It can be used to find patterns and averages, make predictions, test causal relationships, and generalize results to wider populations. Quantitative research is the opposite of qualitative research, which involves collecting and analyzing ...
Choosing an optimal research methodology is crucial for the success of any research project. The methodology you select will determine the type of data you collect, how you collect it, and how you analyse it. ... If the goal is to establish facts about a subject or topic, quantitative research is an appropriate choice. However, if the goal is ...
Quantitative methods emphasize objective measurements and the statistical, mathematical, or numerical analysis of data collected through polls, questionnaires, and surveys, or by manipulating pre-existing statistical data using computational techniques.Quantitative research focuses on gathering numerical data and generalizing it across groups of people or to explain a particular phenomenon.
Step 1: Check the requirements. Step 2: Choose a broad field of research. Step 3: Look for books and articles. Step 4: Find a niche. Step 5: Consider the type of research. Step 6: Determine the relevance. Step 7: Make sure it's plausible. Step 8: Get your topic approved. Other interesting articles.
Select a topic. Choosing an interesting research topic is your first challenge. Here are some tips: Choose a topic that you are interested in! The research process is more relevant if you care about your topic. Narrow your topic to something manageable. If your topic is too broad, you will find too much information and not be able to focus.
For most research topics you can choose a qualitative, quantitative or mixed methods approach. Which type you choose depends on, among other things, whether you're taking an inductive vs. deductive research approach ; your research question(s) ; whether you're doing experimental , correlational , or descriptive research ; and practical ...
Key Concepts in Quantitative Research. In this module, we are going to explore the nuances of quantitative research, including the main types of quantitative research, more exploration into variables (including confounding and extraneous variables), and causation. Content includes: Objectives: Discuss the flaws, proof, and rigor in research.
This type of research can be used to establish generalisable facts about a topic. Common quantitative methods include experiments, observations recorded as numbers, and surveys with closed-ended questions. Qualitative research. Qualitative research is expressed in words. It is used to understand concepts, thoughts or experiences.
Quantitative research methods provide an relatively conclusive answer to the research questions. When the data is collected and analyzed in accordance with standardized, reputable methodology, the results are usually trustworthy. With statistically significant sample sizes, the results can be generalized to an entire target group.
Step 1. Choose a Topic. Choosing an interesting research topic can be challenging. This video tutorial will help you select and properly scope your topic by employing questioning, free writing, and mind mapping techniques so that you can formulate a research question. Developing a Research Question.
Step 2: Choose a type of research design. Within both qualitative and quantitative approaches, there are several types of research design to choose from. Each type provides a framework for the overall shape of your research. Types of quantitative research designs. Quantitative designs can be split into four main types.
Step 2: Choose a type of research design. Within both qualitative and quantitative approaches, there are several types of research design to choose from. Each type provides a framework for the overall shape of your research. Types of quantitative research designs. Quantitative designs can be split into four main types.
Quantitative research involves analyzing and gathering numerical data to uncover trends, calculate averages, evaluate relationships, and derive overarching insights. It's used in various fields, including the natural and social sciences. Quantitative data analysis employs statistical techniques for processing and interpreting numeric data.
Advantages of quantitative research 1,2. When choosing the right research methodology, also consider the advantages of quantitative research and how it can impact your study. Quantitative research methods are more scientific and rational. They use quantifiable data leading to objectivity in the results and avoid any chances of ambiguity.
A good research question is essential to guide your research paper, dissertation, or thesis. All research questions should be: Focused on a single problem or issue. Researchable using primary and/or secondary sources. Feasible to answer within the timeframe and practical constraints. Specific enough to answer thoroughly.
Here are some key characteristics of quantitative research: Numerical data: Quantitative research involves collecting numerical data through standardized methods such as surveys, experiments, and observational studies. This data is analyzed using statistical methods to identify patterns and relationships.
Step 1: Consider a Topic that Interests You. If your professor has asked you to choose a topic for your research paper, it means you can choose just about any subject to focus on in your area of study. A significant first step to take is to consider topics that interest you. An interesting topic should meet two very important conditions.
Abstract. Selection of a research topic is a challenge for students and professionals alike. This paper addresses those challenges by presenting some strategies based on existing body of knowledge ...
Step 1: Choose your topic. First you have to come up with some ideas. Your thesis or dissertation topic can start out very broad. Think about the general area or field you're interested in—maybe you already have specific research interests based on classes you've taken, or maybe you had to consider your topic when applying to graduate school and writing a statement of purpose.